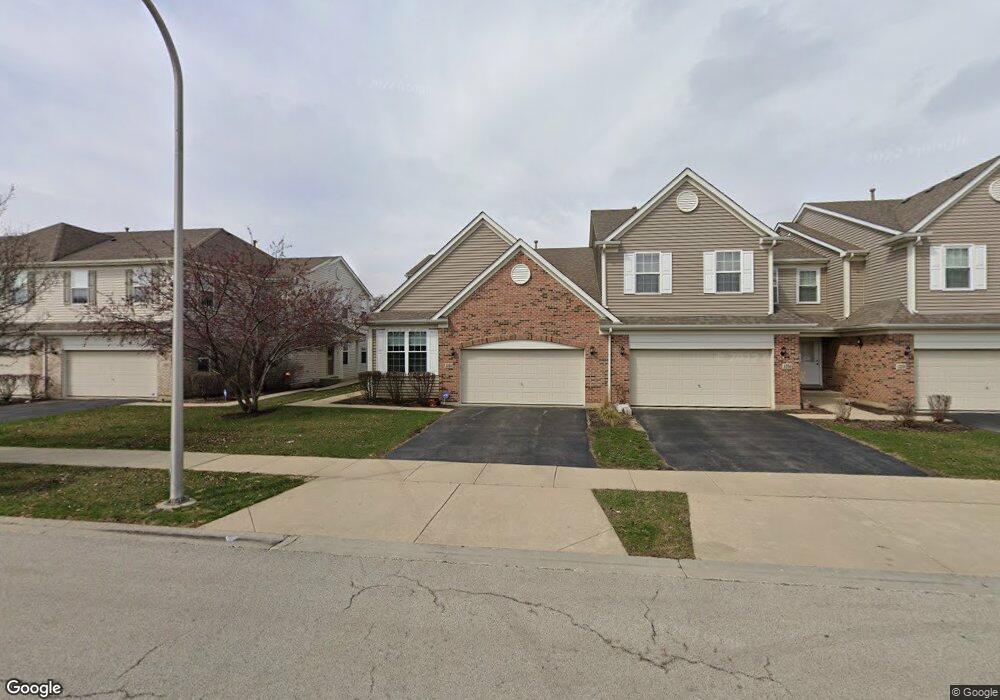
1254 Bradley Cir Unit 1 Elgin, IL 60120
Cobblers Crossing NeighborhoodEstimated Value: $385,674 - $405,000
3
Beds
3
Baths
1,926
Sq Ft
$205/Sq Ft
Est. Value
About This Home
This home is located at 1254 Bradley Cir Unit 1, Elgin, IL 60120 and is currently estimated at $394,669, approximately $204 per square foot. 1254 Bradley Cir Unit 1 is a home located in Cook County with nearby schools including Lincoln Elementary School, Larsen Middle School, and Elgin High School.
Ownership History
Date
Name
Owned For
Owner Type
Purchase Details
Closed on
Nov 21, 2007
Sold by
Princeton West Llc
Bought by
Patel Anilkumar and Patel Saroj K
Current Estimated Value
Home Financials for this Owner
Home Financials are based on the most recent Mortgage that was taken out on this home.
Original Mortgage
$220,000
Outstanding Balance
$139,209
Interest Rate
6.47%
Mortgage Type
Purchase Money Mortgage
Estimated Equity
$255,460
Create a Home Valuation Report for This Property
The Home Valuation Report is an in-depth analysis detailing your home's value as well as a comparison with similar homes in the area
Home Values in the Area
Average Home Value in this Area
Purchase History
| Date | Buyer | Sale Price | Title Company |
|---|---|---|---|
| Patel Anilkumar | $285,000 | None Available |
Source: Public Records
Mortgage History
| Date | Status | Borrower | Loan Amount |
|---|---|---|---|
| Open | Patel Anilkumar | $220,000 |
Source: Public Records
Tax History Compared to Growth
Tax History
| Year | Tax Paid | Tax Assessment Tax Assessment Total Assessment is a certain percentage of the fair market value that is determined by local assessors to be the total taxable value of land and additions on the property. | Land | Improvement |
|---|---|---|---|---|
| 2024 | $5,193 | $24,008 | $4,825 | $19,183 |
| 2023 | $4,993 | $24,008 | $4,825 | $19,183 |
| 2022 | $4,993 | $24,008 | $4,825 | $19,183 |
| 2021 | $4,626 | $19,418 | $3,101 | $16,317 |
| 2020 | $4,737 | $19,418 | $3,101 | $16,317 |
| 2019 | $4,748 | $21,663 | $3,101 | $18,562 |
| 2018 | $3,476 | $16,415 | $2,756 | $13,659 |
| 2017 | $3,502 | $16,415 | $2,756 | $13,659 |
| 2016 | $3,867 | $16,415 | $2,756 | $13,659 |
| 2015 | $3,693 | $15,007 | $2,412 | $12,595 |
| 2014 | $3,608 | $15,007 | $2,412 | $12,595 |
| 2013 | $3,903 | $13,817 | $2,412 | $11,405 |
Source: Public Records
Map
Nearby Homes
- 1104 Loganbury Ct Unit 33211
- 1212 Shawford Way Unit 17
- 6099 Canterbury Ln Unit 302
- 6073 Canterbury Ln Unit 335
- 1818 Kelberg Ave
- 1816 Kelberg Ave Unit 484
- 1870 Hampshire Dr
- 6034 Delaney Dr Unit 171
- 1080 Wakefield Dr
- 2221 Edgartown Ln
- 1798 Newberry Ln
- Vacant Lot Parcel 1 Congdon Ave
- 796 Parkway Ave
- 5815 Fairview Ln
- 1102 Coldspring Rd
- 1152 Hiawatha Dr
- 1103 Hiawatha Dr
- 879 Dandridge Ct
- 1409 Dundee Ave
- 1503 Kenneth Cir
- 1256 Bradley Cir Unit 521256
- 1250 Bradley Cir Unit 461250
- 1258 Bradley Cir Unit 531258
- 1248 Bradley Cir Unit 451248
- 1260 Bradley Cir Unit 541260
- 1246 Bradley Cir Unit 441246
- 1262 Bradley Cir Unit 551262
- 1262 Bradley Cir Unit 5
- 1244 Bradley Cir Unit 431244
- 1264 Bradley Cir Unit 561264
- 1214 Bradley Cir
- 1212 Bradley Cir
- 1218 Bradley Cir
- 1372 Bradley Cir
- 1242 Bradley Cir Unit 421242
- 1255 Bradley Cir Unit 191125
- 1255 Bradley Cir Unit 1
- 1368 Bradley Cir Unit 851372
- 1368 Bradley Cir Unit 841370
- 1368 Bradley Cir