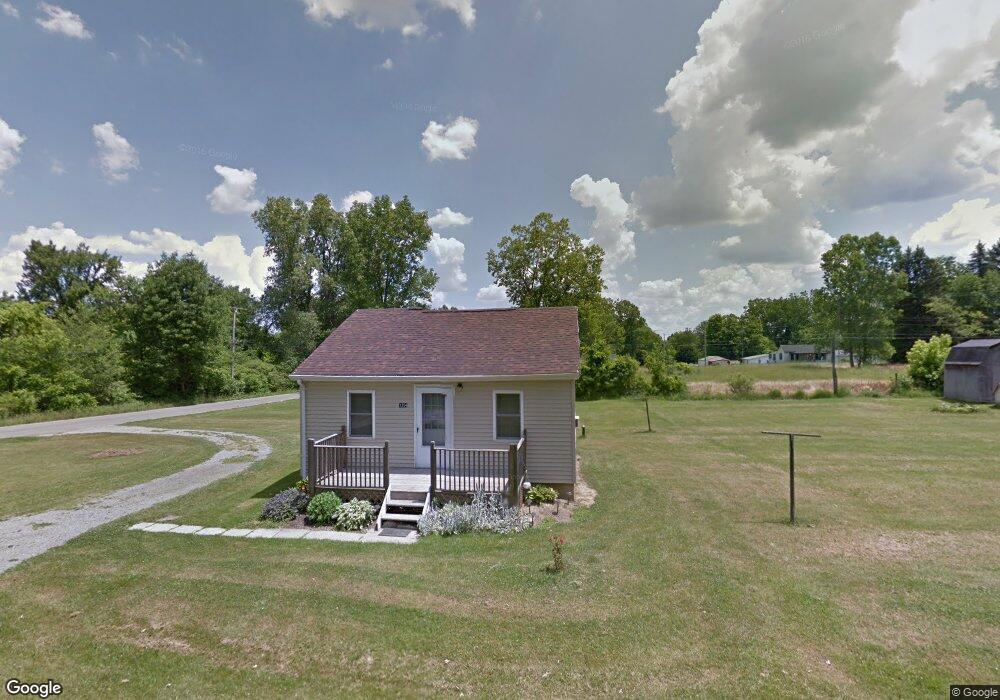
1254 Crandal Rd Mansfield, OH 44906
Estimated Value: $53,000 - $89,000
1
Bed
1
Bath
576
Sq Ft
$123/Sq Ft
Est. Value
About This Home
This home is located at 1254 Crandal Rd, Mansfield, OH 44906 and is currently estimated at $70,733, approximately $122 per square foot. 1254 Crandal Rd is a home located in Richland County with nearby schools including Foundation Academy, Mansfield Elective Academy, and Goal Digital Academy.
Ownership History
Date
Name
Owned For
Owner Type
Purchase Details
Closed on
Jan 11, 2022
Sold by
Jason Hoak
Bought by
Mowry Brian N and Mowry Tonia M
Current Estimated Value
Purchase Details
Closed on
Dec 1, 2021
Sold by
Simmons James R
Bought by
Hoak Jason
Purchase Details
Closed on
Jul 27, 2020
Sold by
Carroll Mary H
Bought by
Simmons James R
Purchase Details
Closed on
Jun 20, 2013
Sold by
Keaton Odolene
Bought by
Carroll Mary H
Purchase Details
Closed on
Jun 19, 2008
Sold by
Blackburn Douglas and Blackburn Jean
Bought by
Keaton Odolene
Purchase Details
Closed on
Aug 6, 2004
Sold by
Blackburn Douglas and Blackburn Jean
Bought by
French Tim
Home Financials for this Owner
Home Financials are based on the most recent Mortgage that was taken out on this home.
Original Mortgage
$16,200
Interest Rate
5%
Mortgage Type
Seller Take Back
Purchase Details
Closed on
Aug 19, 2002
Sold by
Craft Rachel J
Bought by
Blackburn Douglas and Blackburn Jean
Create a Home Valuation Report for This Property
The Home Valuation Report is an in-depth analysis detailing your home's value as well as a comparison with similar homes in the area
Home Values in the Area
Average Home Value in this Area
Purchase History
| Date | Buyer | Sale Price | Title Company |
|---|---|---|---|
| Mowry Brian N | $40,000 | Law Office Of Andrew N Bush Ll | |
| Hoak Jason | $29,000 | Castle Real Estate Title Llc | |
| Simmons James R | -- | Hawkins Title Research | |
| Carroll Mary H | $16,000 | Southern Title | |
| Keaton Odolene | $31,500 | Southern Title | |
| French Tim | $16,200 | -- | |
| Blackburn Douglas | $12,000 | -- |
Source: Public Records
Mortgage History
| Date | Status | Borrower | Loan Amount |
|---|---|---|---|
| Previous Owner | French Tim | $16,200 |
Source: Public Records
Tax History Compared to Growth
Tax History
| Year | Tax Paid | Tax Assessment Tax Assessment Total Assessment is a certain percentage of the fair market value that is determined by local assessors to be the total taxable value of land and additions on the property. | Land | Improvement |
|---|---|---|---|---|
| 2024 | $614 | $12,820 | $2,450 | $10,370 |
| 2023 | $614 | $12,820 | $2,450 | $10,370 |
| 2022 | $464 | $8,120 | $2,180 | $5,940 |
| 2021 | $467 | $8,120 | $2,180 | $5,940 |
| 2020 | $478 | $8,120 | $2,180 | $5,940 |
| 2019 | $530 | $8,120 | $2,180 | $5,940 |
| 2018 | $523 | $8,120 | $2,180 | $5,940 |
| 2017 | $509 | $8,120 | $2,180 | $5,940 |
| 2016 | $515 | $7,970 | $2,080 | $5,890 |
| 2015 | $492 | $7,970 | $2,080 | $5,890 |
| 2014 | $485 | $7,970 | $2,080 | $5,890 |
| 2012 | $6 | $7,970 | $2,180 | $5,790 |
Source: Public Records
Map
Nearby Homes
- 0 Stone Rd
- 356 Warren Rd
- 0 Herring Ave
- 939 Country Club Dr
- 1134 Fairfax Ave
- 1170 Fairfax Ave
- 946 Belmont Ave
- 933 Fairfax Ave
- 876 Fairfax Ave
- 1245 N Trimble Rd
- 874 Fairfax Ave
- 673 Armstrong St Unit 23
- 741 Burger Ave
- 674 Averill Ave
- 743 Bowman St
- 283 Bulkley Ave
- 0 State Route 314 Unit 9067316
- 0 State Route 314 Unit 225021979
- 688 Mcpherson St
- 1169 Seminole Ave