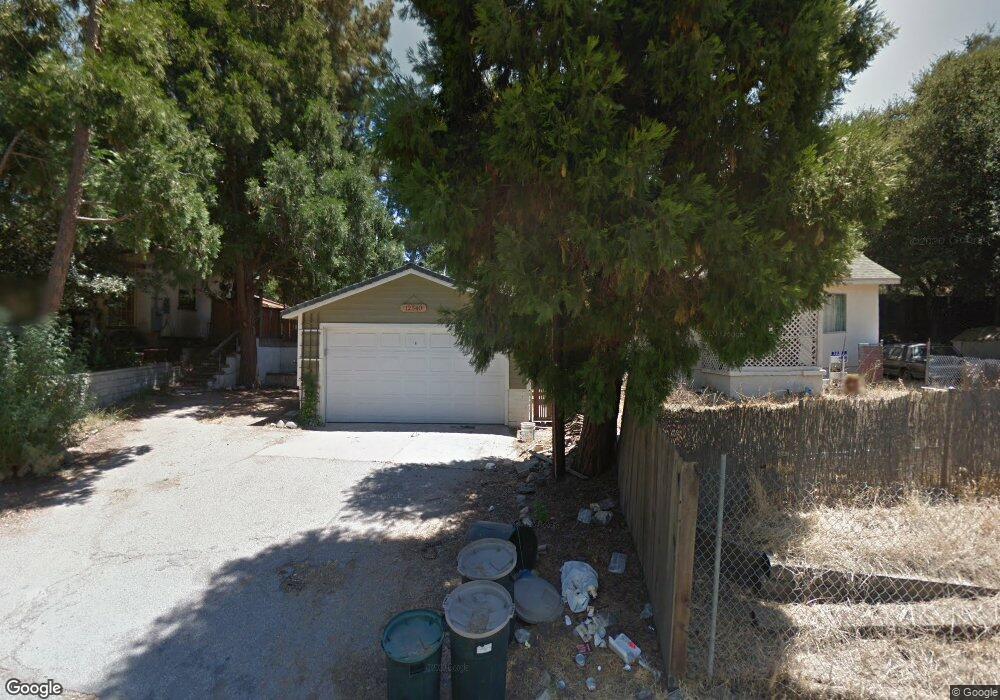
12540 El Merrie Del Dr Sylmar, CA 91342
Estimated Value: $680,000 - $796,000
2
Beds
2
Baths
1,096
Sq Ft
$669/Sq Ft
Est. Value
About This Home
This home is located at 12540 El Merrie Del Dr, Sylmar, CA 91342 and is currently estimated at $733,249, approximately $669 per square foot. 12540 El Merrie Del Dr is a home located in Los Angeles County with nearby schools including Brainard Elementary School, Charles Maclay Middle School, and Mt. Gleason Middle School.
Ownership History
Date
Name
Owned For
Owner Type
Purchase Details
Closed on
Aug 19, 2015
Sold by
The Amour Trust
Bought by
Hill Rodney Allen and Nonaka Hill Takayoshi
Current Estimated Value
Home Financials for this Owner
Home Financials are based on the most recent Mortgage that was taken out on this home.
Original Mortgage
$407,483
Outstanding Balance
$317,400
Interest Rate
3.75%
Mortgage Type
FHA
Estimated Equity
$415,849
Purchase Details
Closed on
May 30, 2014
Sold by
Scherr Annette K
Bought by
The Amor Trust
Home Financials for this Owner
Home Financials are based on the most recent Mortgage that was taken out on this home.
Original Mortgage
$65,000
Interest Rate
4.16%
Mortgage Type
Seller Take Back
Create a Home Valuation Report for This Property
The Home Valuation Report is an in-depth analysis detailing your home's value as well as a comparison with similar homes in the area
Home Values in the Area
Average Home Value in this Area
Purchase History
| Date | Buyer | Sale Price | Title Company |
|---|---|---|---|
| Hill Rodney Allen | $415,000 | Fidelity Sherman Oaks | |
| The Amor Trust | -- | Fidelity Title |
Source: Public Records
Mortgage History
| Date | Status | Borrower | Loan Amount |
|---|---|---|---|
| Open | Hill Rodney Allen | $407,483 | |
| Previous Owner | The Amor Trust | $65,000 |
Source: Public Records
Tax History Compared to Growth
Tax History
| Year | Tax Paid | Tax Assessment Tax Assessment Total Assessment is a certain percentage of the fair market value that is determined by local assessors to be the total taxable value of land and additions on the property. | Land | Improvement |
|---|---|---|---|---|
| 2025 | $6,029 | $491,267 | $385,914 | $105,353 |
| 2024 | $6,029 | $481,636 | $378,348 | $103,288 |
| 2023 | $5,889 | $472,193 | $370,930 | $101,263 |
| 2022 | $5,548 | $462,935 | $363,657 | $99,278 |
| 2021 | $5,484 | $453,859 | $356,527 | $97,332 |
| 2020 | $5,532 | $449,206 | $352,872 | $96,334 |
| 2019 | $5,301 | $440,399 | $345,953 | $94,446 |
| 2018 | $5,252 | $431,765 | $339,170 | $92,595 |
| 2016 | $5,017 | $415,000 | $326,000 | $89,000 |
| 2015 | $2,678 | $214,195 | $112,197 | $101,998 |
| 2014 | $1,989 | $151,450 | $50,480 | $100,970 |
Source: Public Records
Map
Nearby Homes
- 12558 El Merrie Del Dr
- 0 Shafer Place
- 12605 Trail 01
- 0 Santol Dr
- 12605 Kagel Canyon Rd
- 11153 North Trail
- 12460 Veranda Dr
- 11344 Santol Dr
- 12540 Dexter Park Rd
- 0 North Trail Unit SR24080358
- 0 North Trail Unit 25005234
- 0 North Trail Unit SR23176546
- 0 North Trail Unit 24002410
- 0 Veranda Dr Unit CV25177332
- 12300 Spring Trail
- 0 Spring Trail Unit PW21185754
- 12055 Kagel Canyon Rd
- 12047 Kagel Canyon Rd
- 0 Terra Vista Way
- 11825 Terra Vista Way Unit 133
- 12540 El Merrie Del Dr
- 12538 El Merrie Del Dr
- 12544 El Merrie Del Dr
- 12554 El Merrie Del Dr
- 12553 El Merrie Del Dr
- 12557 Kagel Canyon Rd
- 12557 Kagel Canyon Rd
- 12535 El Merrie Del Dr
- 12543 El Merrie Del Dr
- 12531 El Merrie Del Dr
- 12524 El Merrie Del Dr
- 12557 El Merrie Del Dr
- 12519 El Merrie Del Dr
- 12562 El Merrie Del Dr
- 12571 Kagel Canyon Rd
- 12521 El Merrie Del Dr
- 12509 El Merrie Del Dr
- 11220 Blue Sage Dr
- 0 Trail 10 Unit 14-747477
- 12512 El Merrie Del Dr