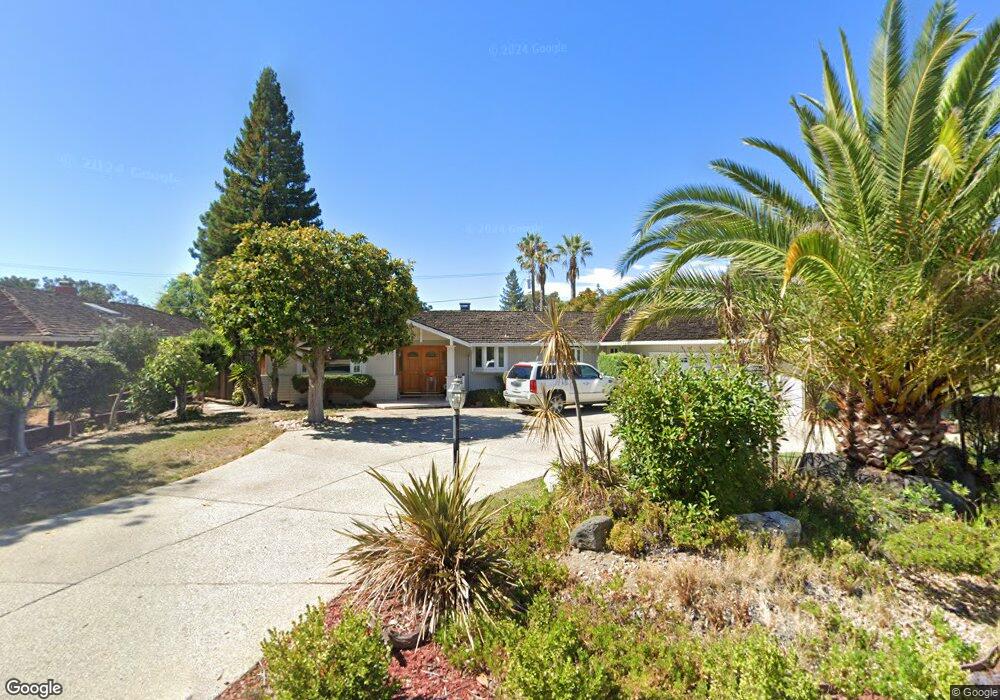
12547 Saratoga Creek Dr Saratoga, CA 95070
West San Jose NeighborhoodEstimated Value: $3,293,132 - $3,468,000
3
Beds
3
Baths
2,163
Sq Ft
$1,558/Sq Ft
Est. Value
About This Home
This home is located at 12547 Saratoga Creek Dr, Saratoga, CA 95070 and is currently estimated at $3,369,783, approximately $1,557 per square foot. 12547 Saratoga Creek Dr is a home located in Santa Clara County with nearby schools including Country Lane Elementary School, Moreland Middle School, and Prospect High School.
Ownership History
Date
Name
Owned For
Owner Type
Purchase Details
Closed on
Mar 7, 2019
Sold by
Vadney Donald A and Vadney Gloria G
Bought by
Vadney Donald A and Vadney Gloria G
Current Estimated Value
Purchase Details
Closed on
Aug 11, 2006
Sold by
Vadney Donald A and Vadney Gloria G
Bought by
Vadney Donald A and Vadney Gloria G
Home Financials for this Owner
Home Financials are based on the most recent Mortgage that was taken out on this home.
Original Mortgage
$250,000
Outstanding Balance
$149,606
Interest Rate
6.7%
Mortgage Type
Credit Line Revolving
Estimated Equity
$3,220,177
Purchase Details
Closed on
Sep 7, 2004
Sold by
Moses Jason J and Moses Mary Louise
Bought by
Vadney Donald A and Vadney Gloria G
Home Financials for this Owner
Home Financials are based on the most recent Mortgage that was taken out on this home.
Original Mortgage
$867,750
Outstanding Balance
$373,751
Interest Rate
3.95%
Mortgage Type
Negative Amortization
Estimated Equity
$2,996,032
Create a Home Valuation Report for This Property
The Home Valuation Report is an in-depth analysis detailing your home's value as well as a comparison with similar homes in the area
Home Values in the Area
Average Home Value in this Area
Purchase History
| Date | Buyer | Sale Price | Title Company |
|---|---|---|---|
| Vadney Donald A | -- | None Available | |
| Vadney Donald A | -- | Alliance Title Company | |
| Vadney Donald A | $1,157,000 | First American Title Company |
Source: Public Records
Mortgage History
| Date | Status | Borrower | Loan Amount |
|---|---|---|---|
| Open | Vadney Donald A | $250,000 | |
| Open | Vadney Donald A | $385,000 | |
| Open | Vadney Donald A | $867,750 |
Source: Public Records
Tax History Compared to Growth
Tax History
| Year | Tax Paid | Tax Assessment Tax Assessment Total Assessment is a certain percentage of the fair market value that is determined by local assessors to be the total taxable value of land and additions on the property. | Land | Improvement |
|---|---|---|---|---|
| 2025 | $20,174 | $1,612,743 | $1,370,769 | $241,974 |
| 2024 | $20,174 | $1,581,122 | $1,343,892 | $237,230 |
| 2023 | $19,996 | $1,550,121 | $1,317,542 | $232,579 |
| 2022 | $19,624 | $1,519,727 | $1,291,708 | $228,019 |
| 2021 | $19,342 | $1,489,930 | $1,266,381 | $223,549 |
| 2020 | $19,057 | $1,474,653 | $1,253,396 | $221,257 |
| 2019 | $18,295 | $1,445,739 | $1,228,820 | $216,919 |
| 2018 | $17,934 | $1,417,392 | $1,204,726 | $212,666 |
| 2017 | $17,833 | $1,389,601 | $1,181,104 | $208,497 |
| 2016 | $16,863 | $1,362,355 | $1,157,946 | $204,409 |
| 2015 | $16,708 | $1,341,892 | $1,140,553 | $201,339 |
| 2014 | $16,312 | $1,315,608 | $1,118,212 | $197,396 |
Source: Public Records
Map
Nearby Homes
- 11315 Cottonwood Place Unit 39-09 Plan 3
- 10750 Elm Cir Unit 88-17 Plan 2
- 11010 Maple Place Unit 25-06 Plan 4
- 10730 Elm Cir Unit 86-17 Plan 2
- Plan 2 at The Elms
- Plan 3 at The Elms
- Plan 4 at The Elms
- 11210 Cottonwood Place Unit 35-08 Plan 4
- 11645 Redwood Place Unit 56-12 Plan 4
- 11220 Cottonwood Place Unit 36-08 Plan 2
- 11240 Cottonwood Place Unit 38-08 Plan 3
- 11115 Maple Place Unit 30-07
- 11125 Maple Place Unit 31-07 Plan 2
- 11145 Maple Place Unit 33-07 Plan 2
- 12584 Paseo Flores
- 19423 Vineyard Ln
- 11155 Maple Place Unit 34-07 Plan 3
- 11040 Maple Place Unit 28-06 Plan 2
- 11050 Maple Place Unit 29-06 Plan 3
- 10330 Elm Cir Unit 12-03 Plan 2
- 12525 Saratoga Creek Dr
- 12567 Saratoga Creek Dr
- 19020 Raleigh Place
- 12503 Saratoga Creek Dr
- 12560 Saratoga Creek Dr
- 12546 Saratoga Creek Dr
- 19030 Raleigh Place
- 12591 Saratoga Creek Dr
- 12584 Saratoga Creek Dr
- 12520 Saratoga Creek Dr
- 18981 Hargrave Way
- 19000 Raleigh Place
- 12481 Saratoga Creek Dr
- 12613 Saratoga Creek Dr
- 18950 Hargrave Way
- 12612 Saratoga Creek Dr
- 19021 Raleigh Place
- 12492 Saratoga Creek Dr
- 18941 Easton Place
- 18951 Easton Place