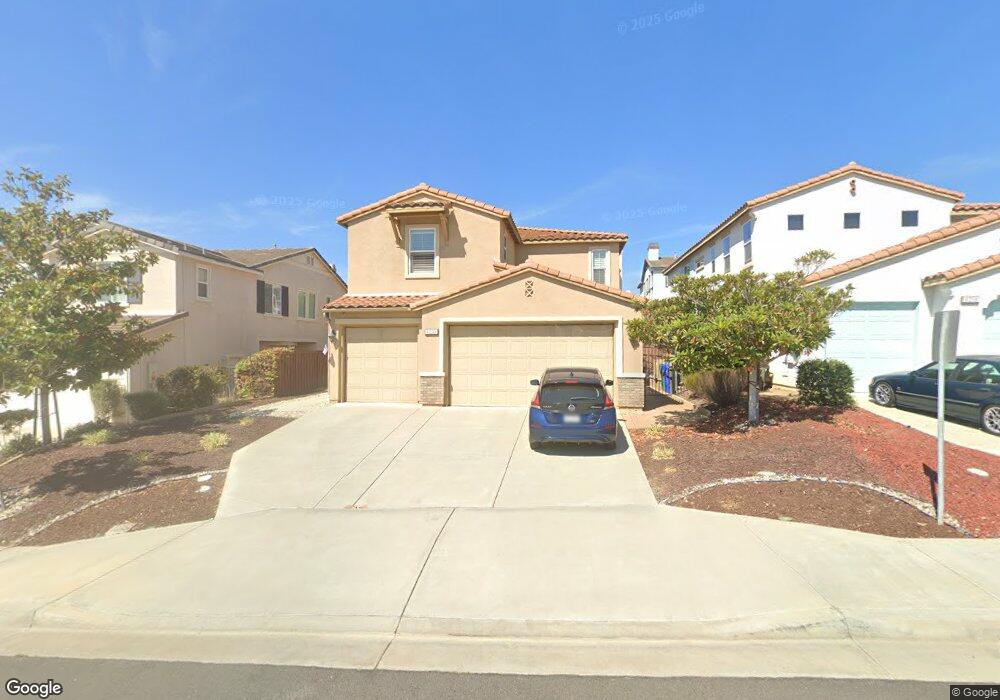
1255 Bellingham Dr Oceanside, CA 92057
North Valley NeighborhoodEstimated Value: $1,146,280 - $1,333,000
About This Home
This home is located at 1255 Bellingham Dr, Oceanside, CA 92057 and is currently estimated at $1,211,570, approximately $378 per square foot. 1255 Bellingham Dr is a home located in San Diego County with nearby schools including Bonsall West Elementary School, Sullivan Middle School, and Bonsall High.
Ownership History
We collect this data history from publicly available records. To have your information removed, we recommend requesting removal directly through your county’s website.
Purchase Details
Home Financials for this Owner
Home Financials are based on the most recent Mortgage that was taken out on this home.Home Values in the Area
Average Home Value in this Area
Purchase History
We collect this data history from publicly available records. To have your information removed, we recommend requesting removal directly through your county’s website.
| Date | Buyer | Sale Price | Title Company |
|---|---|---|---|
| $500,000 | First American Title Company |
Mortgage History
We collect this data history from publicly available records. To have your information removed, we recommend requesting removal directly through your county’s website.
| Date | Status | Borrower | Loan Amount |
|---|---|---|---|
| Open | $492,929 |
Tax History
We collect this data history from publicly available records. To have your information removed, we recommend requesting removal directly through your county’s website.
| Year | Tax Paid | Tax Assessment Tax Assessment Total Assessment is a certain percentage of the fair market value that is determined by local assessors to be the total taxable value of land and additions on the property. | Land | Improvement |
|---|---|---|---|---|
| 2025 | $6,583 | $640,020 | $217,793 | $422,227 |
| 2024 | $6,583 | $627,472 | $213,523 | $413,949 |
| 2023 | $6,437 | $615,170 | $209,337 | $405,833 |
| 2022 | $6,324 | $603,109 | $205,233 | $397,876 |
| 2021 | $6,208 | $591,284 | $201,209 | $390,075 |
| 2020 | $6,158 | $585,222 | $199,146 | $386,076 |
| 2019 | $6,040 | $573,748 | $195,242 | $378,506 |
| 2018 | $6,069 | $562,499 | $191,414 | $371,085 |
| 2017 | $70 | $551,470 | $187,661 | $363,809 |
| 2016 | $5,808 | $540,658 | $183,982 | $356,676 |
| 2015 | $5,716 | $532,538 | $181,219 | $351,319 |
| 2014 | $5,601 | $522,108 | $177,670 | $344,438 |
Map
- 1268 Bellingham Dr
- 5022 Calle Arquero
- 1018 Bellingham Dr
- 795 Via Callado
- 1077 Village Dr
- 4981 Calle Arquero
- 5146 E Parker St
- 1080 Breakaway Dr
- 905 Glendora Dr
- 4901 Tropea St Unit II
- 0 Village Dr
- 290 Hadley Way
- 672 Arthur Ave
- 980 Manteca Dr
- 280 Paxton Way
- 161 Mellano Way
- 167 Mellano Way
- 277 Donal Way
- 656 Parker St
- 671 Parker St
- 1251 Bellingham Dr
- 1259 Bellingham Dr
- 1263 Bellingham Dr
- 1184 Players Dr
- 1180 Players Dr
- 1192 Players Dr
- 1267 Bellingham Dr
- 1254 Bellingham Dr
- 1250 Bellingham Dr
- 1258 Bellingham Dr
- 1196 Players Dr
- 1246 Bellingham Dr
- 1247 Bellingham Dr
- 1262 Bellingham Dr
- 1271 Bellingham Dr
- 1200 Players Dr
- 1264 Bellingham Dr
- 1242 Bellingham Dr
- 1275 Bellingham Dr
- 1243 Bellingham Dr
Ask me questions while you tour the home.