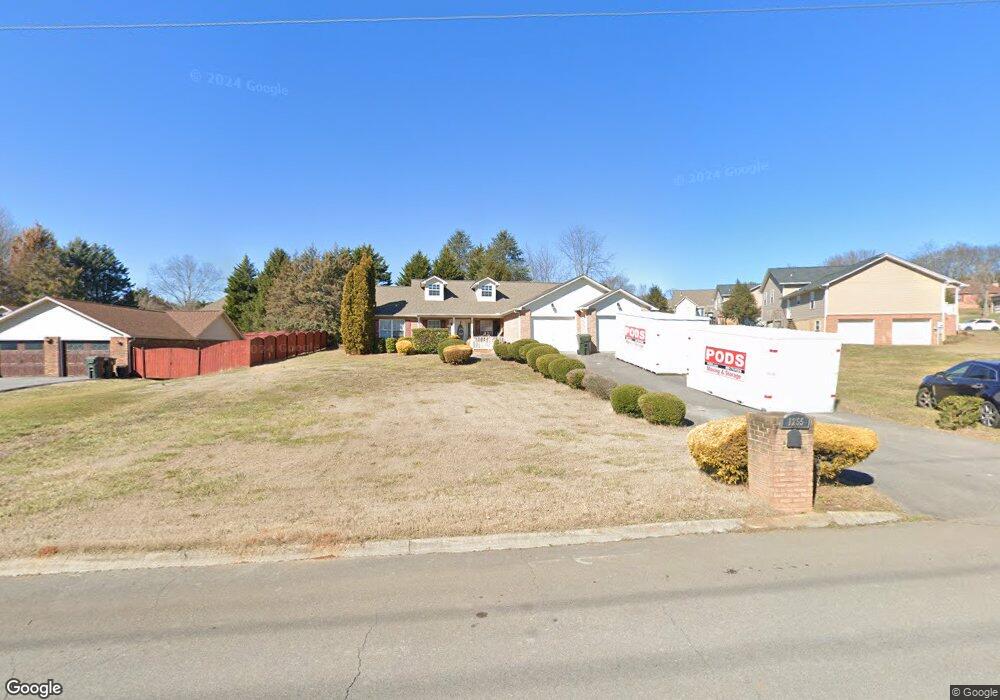
1255 Blake Lea Sevierville, TN 37862
Estimated Value: $459,512 - $483,000
3
Beds
2
Baths
2,139
Sq Ft
$220/Sq Ft
Est. Value
About This Home
This home is located at 1255 Blake Lea, Sevierville, TN 37862 and is currently estimated at $471,256, approximately $220 per square foot. 1255 Blake Lea is a home located in Sevier County with nearby schools including Catons Chapel Elementary School, Northview Elementary School, and Jones Cove Elementary School.
Ownership History
Date
Name
Owned For
Owner Type
Purchase Details
Closed on
Aug 12, 2020
Sold by
Alkhasali Haider M and Obaidi Zena
Bought by
Obaidi Zena
Current Estimated Value
Purchase Details
Closed on
Nov 17, 2008
Sold by
Regions Bank
Bought by
Alkhasali Haider M
Purchase Details
Closed on
May 13, 2008
Sold by
Nguyen Quyen Ton
Bought by
Regions Bank
Purchase Details
Closed on
Apr 27, 2005
Sold by
Keene Darrell
Bought by
Nguyen Quyen Ton
Home Financials for this Owner
Home Financials are based on the most recent Mortgage that was taken out on this home.
Original Mortgage
$144,000
Interest Rate
7.99%
Purchase Details
Closed on
Sep 21, 2004
Bought by
Keene Darrell
Create a Home Valuation Report for This Property
The Home Valuation Report is an in-depth analysis detailing your home's value as well as a comparison with similar homes in the area
Home Values in the Area
Average Home Value in this Area
Purchase History
| Date | Buyer | Sale Price | Title Company |
|---|---|---|---|
| Obaidi Zena | -- | Hometown Title Llc | |
| Alkhasali Haider M | $180,000 | -- | |
| Regions Bank | $156,000 | -- | |
| Nguyen Quyen Ton | $180,000 | -- | |
| Keene Darrell | $110,000 | -- |
Source: Public Records
Mortgage History
| Date | Status | Borrower | Loan Amount |
|---|---|---|---|
| Previous Owner | Keene Darrell | $144,000 |
Source: Public Records
Tax History Compared to Growth
Tax History
| Year | Tax Paid | Tax Assessment Tax Assessment Total Assessment is a certain percentage of the fair market value that is determined by local assessors to be the total taxable value of land and additions on the property. | Land | Improvement |
|---|---|---|---|---|
| 2025 | $2,202 | $74,375 | $8,750 | $65,625 |
| 2024 | $2,202 | $74,375 | $8,750 | $65,625 |
| 2023 | $2,202 | $74,375 | $0 | $0 |
| 2022 | $1,417 | $74,375 | $8,750 | $65,625 |
| 2021 | $1,417 | $74,375 | $8,750 | $65,625 |
| 2020 | $1,241 | $74,375 | $8,750 | $65,625 |
| 2019 | $1,241 | $52,650 | $8,750 | $43,900 |
| 2018 | $1,241 | $52,650 | $8,750 | $43,900 |
| 2017 | $1,241 | $52,650 | $8,750 | $43,900 |
| 2016 | $1,142 | $52,650 | $8,750 | $43,900 |
| 2015 | -- | $52,500 | $0 | $0 |
| 2014 | $1,018 | $52,493 | $0 | $0 |
Source: Public Records
Map
Nearby Homes
- 1220 Ariell Lea
- 1013 Columbine Lea
- 1316 Mountain Meadows Way
- 932 Mountain Berry Dr
- 1218 Ernest McMahan Rd
- 960 Dogwood Ln
- 1201 Briar Lea
- Lot 960A Dogwood Ln
- 410 Fleeta Williams Way
- 1056 Watch Hill Way
- 1064 Watch Hill Way
- 1072 Watch Hill Way
- 1067 Watch Hill Way
- 1043 Watch Hill Way
- 456 Fleeta Williams Way
- 915 Fine Glen Dr
- 1202 Foxwood Dr
- 1350 Snappwood Dr
- 1308 Poplar Ct
- 905 Lacy Ct
- 1253 Blake Lea
- 1263 Blake Lea
- 1230 Ariell Lea
- 1229 Ariell Lea
- 1252 Blake Lea
- 1256 Blake Lea
- 1249 Blake Lea
- 1265 Blake Lea
- 1260 Blake Lea
- 1228 Ariell Lea
- 1264 Blake Lea
- 902 Ashley Lea
- 1209 Ariell Lea
- 907 Ashley Lea
- 1205 Ariell Lea
- 1219 Ariell Lea
- 919 Ashley Lea
- 1033 Columbine Lea
- 1268 Blake Lea
- 1224 Ariell Lea