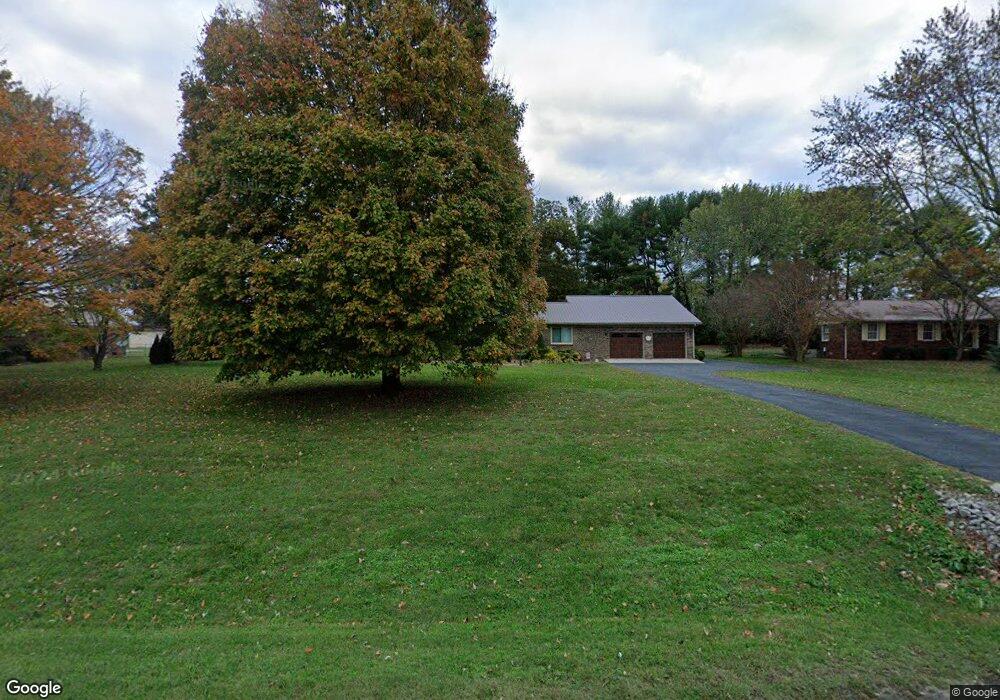
1255 Bypass Rd Winchester, TN 37398
Estimated Value: $325,461 - $412,000
--
Bed
2
Baths
2,098
Sq Ft
$177/Sq Ft
Est. Value
About This Home
This home is located at 1255 Bypass Rd, Winchester, TN 37398 and is currently estimated at $372,365, approximately $177 per square foot. 1255 Bypass Rd is a home located in Franklin County with nearby schools including South Middle School, Franklin County High School, and School of the Good Shepherd.
Ownership History
Date
Name
Owned For
Owner Type
Purchase Details
Closed on
Jan 31, 2020
Sold by
Cox Alfred Bruce and Cox Beverly Carol
Bought by
Lian Ronald and Lian Misty
Current Estimated Value
Home Financials for this Owner
Home Financials are based on the most recent Mortgage that was taken out on this home.
Original Mortgage
$198,550
Outstanding Balance
$176,135
Interest Rate
3.7%
Mortgage Type
New Conventional
Estimated Equity
$196,230
Purchase Details
Closed on
Jun 27, 2018
Sold by
Larry A Collins
Bought by
Cox Alfred and Cox Beverly
Home Financials for this Owner
Home Financials are based on the most recent Mortgage that was taken out on this home.
Original Mortgage
$130,000
Interest Rate
4.57%
Purchase Details
Closed on
Mar 31, 1983
Bought by
Collins Larry A
Purchase Details
Closed on
Sep 12, 1978
Create a Home Valuation Report for This Property
The Home Valuation Report is an in-depth analysis detailing your home's value as well as a comparison with similar homes in the area
Home Values in the Area
Average Home Value in this Area
Purchase History
| Date | Buyer | Sale Price | Title Company |
|---|---|---|---|
| Lian Ronald | $209,000 | Access Title & Escrow Inc | |
| Cox Alfred | $183,000 | -- | |
| Collins Larry A | -- | -- | |
| -- | -- | -- |
Source: Public Records
Mortgage History
| Date | Status | Borrower | Loan Amount |
|---|---|---|---|
| Open | Lian Ronald | $198,550 | |
| Previous Owner | Not Available | $130,000 | |
| Previous Owner | Not Available | -- |
Source: Public Records
Tax History Compared to Growth
Tax History
| Year | Tax Paid | Tax Assessment Tax Assessment Total Assessment is a certain percentage of the fair market value that is determined by local assessors to be the total taxable value of land and additions on the property. | Land | Improvement |
|---|---|---|---|---|
| 2024 | $1,917 | $74,550 | $4,500 | $70,050 |
| 2023 | $1,917 | $74,550 | $4,500 | $70,050 |
| 2022 | $1,880 | $74,550 | $4,500 | $70,050 |
| 2021 | $1,137 | $74,550 | $4,500 | $70,050 |
| 2020 | $1,569 | $44,400 | $4,175 | $40,225 |
| 2019 | $1,569 | $44,400 | $4,175 | $40,225 |
| 2018 | $1,478 | $44,400 | $4,175 | $40,225 |
| 2017 | $1,478 | $44,400 | $4,175 | $40,225 |
| 2016 | $1,358 | $40,800 | $3,700 | $37,100 |
| 2015 | $1,334 | $40,800 | $3,700 | $37,100 |
| 2014 | $1,334 | $40,806 | $0 | $0 |
Source: Public Records
Map
Nearby Homes
- 144 Wood Bluff Rd
- 105 Edgewater Dr
- 206 Homeward Ave
- 0 S College St Unit RTC2942332
- 309 Woodcrest Dr
- 1506 Old Cowan Rd
- 41 Cheyenne Ave
- 362 Chase Cir
- 190 Cheyenne Ave
- 0 Deer Valley Cir Unit RTC2980817
- 0 Deer Valley Cir Unit RTC2980816
- 0 Deer Valley Cir Unit RTC2980815
- 0 Deer Valley Cir Unit RTC2980813
- 0 Deer Valley Cir Unit RTC2980812
- 0 Deer Valley Cir Unit RTC2980811
- 0 Deer Valley Cir Unit RTC2980810
- 0 Deer Valley Cir Unit RTC2980808
- 0 Deer Valley Cir Unit RTC2980805
- 0 Deer Valley Cir Unit RTC2980803
- 0 Deer Valley Cir Unit RTC2980802
- 1281 Bypass Rd
- 1229 Bypass Rd
- 77 Greenview Dr
- 113 Greenview Dr
- 1201 Bypass Rd
- 137 Greenview Dr
- 1325 Bypass Rd
- 161 Greenview Dr
- 74 Greenview Dr
- 1171 Bypass Rd
- 116 Greenview Dr
- 138 Greenview Dr
- 1347 Bypass Rd
- 1135 Bypass Rd
- 246 Georgia Crossing Rd
- 280 Georgia Crossing Rd
- 1071 Bypass Rd
- 135 Peter Turney Ln Unit 133
- 145 Peter Turney Ln Unit 143
- 1464 Bypass Rd