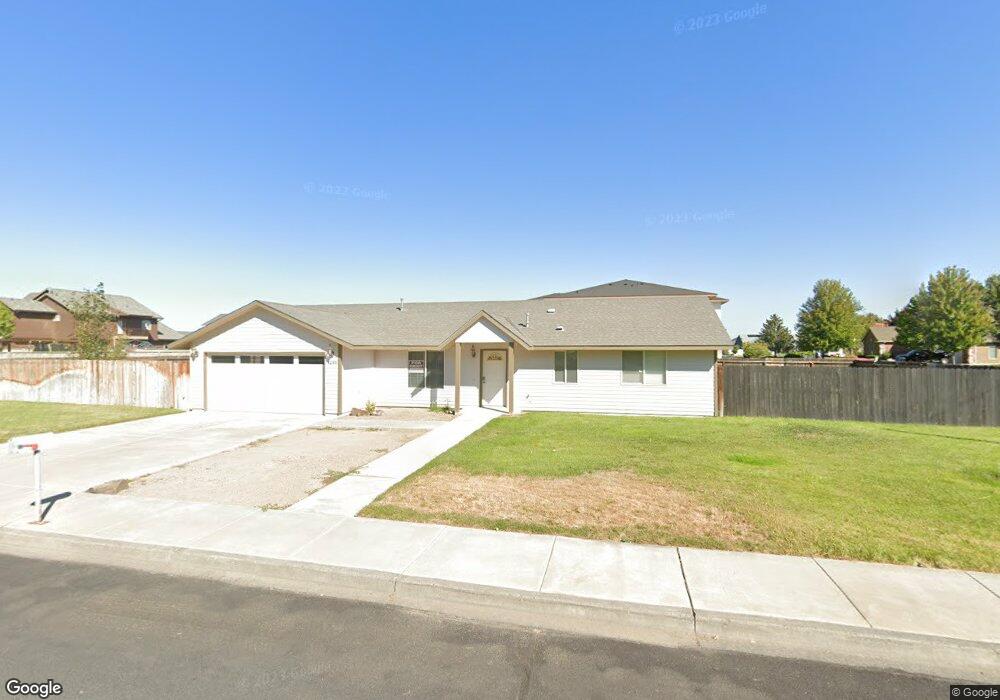
1255 E Rainier St Othello, WA 99344
Estimated Value: $318,000 - $418,000
3
Beds
2
Baths
1,440
Sq Ft
$245/Sq Ft
Est. Value
About This Home
This home is located at 1255 E Rainier St, Othello, WA 99344 and is currently estimated at $353,349, approximately $245 per square foot. 1255 E Rainier St is a home located in Adams County with nearby schools including Othello High School and Liberty Bell Academy.
Ownership History
Date
Name
Owned For
Owner Type
Purchase Details
Closed on
Feb 13, 2017
Sold by
Torres Alva
Bought by
Felice Stephen J and Felice Adela G
Current Estimated Value
Home Financials for this Owner
Home Financials are based on the most recent Mortgage that was taken out on this home.
Original Mortgage
$144,000
Outstanding Balance
$119,624
Interest Rate
4.32%
Mortgage Type
New Conventional
Estimated Equity
$233,725
Purchase Details
Closed on
Nov 4, 2016
Sold by
Torres Alexis
Bought by
Torres Alva
Purchase Details
Closed on
Jan 10, 2015
Sold by
Gonzalez Magdeleno R and Segura Rosalina
Bought by
Torres Alexis and Torres Alva R
Home Financials for this Owner
Home Financials are based on the most recent Mortgage that was taken out on this home.
Original Mortgage
$153,664
Interest Rate
3.8%
Mortgage Type
FHA
Create a Home Valuation Report for This Property
The Home Valuation Report is an in-depth analysis detailing your home's value as well as a comparison with similar homes in the area
Purchase History
| Date | Buyer | Sale Price | Title Company |
|---|---|---|---|
| Felice Stephen J | $180,000 | Frontier Title Co | |
| Torres Alva | -- | None Available | |
| Torres Alexis | $156,500 | First American Title Ins Co |
Source: Public Records
Mortgage History
| Date | Status | Borrower | Loan Amount |
|---|---|---|---|
| Open | Felice Stephen J | $144,000 | |
| Previous Owner | Torres Alexis | $153,664 |
Source: Public Records
Tax History
| Year | Tax Paid | Tax Assessment Tax Assessment Total Assessment is a certain percentage of the fair market value that is determined by local assessors to be the total taxable value of land and additions on the property. | Land | Improvement |
|---|---|---|---|---|
| 2024 | $2,752 | $248,200 | $61,300 | $186,900 |
| 2023 | $2,752 | $228,700 | $56,800 | $171,900 |
| 2022 | $2,534 | $194,900 | $45,400 | $149,500 |
| 2021 | $2,495 | $194,900 | $45,400 | $149,500 |
| 2020 | $2,286 | $183,700 | $45,400 | $138,300 |
| 2019 | $1,882 | $172,000 | $45,400 | $126,600 |
| 2018 | $1,882 | $141,300 | $31,300 | $110,000 |
| 2017 | $1,880 | $141,300 | $31,300 | $110,000 |
| 2016 | $2,227 | $141,300 | $31,300 | $110,000 |
| 2015 | $2,227 | $141,300 | $31,300 | $110,000 |
| 2014 | $2,227 | $143,400 | $31,300 | $112,100 |
| 2012 | $2,227 | $156,600 | $31,300 | $125,300 |
Source: Public Records
Map
Nearby Homes
- 1205 E Rainier St
- 1105 E Olympia St
- 1120 E Mt Adams St
- 1209 E Mt Hood St
- 1144 E Mt Hood St
- 1259 E Mt Hood St
- 1124 E Mt Hood St
- 1134 E Mt Hood St
- 1224 E Mt Hood St
- 1161 E Mt Hood St
- 705 E Mt Adams St
- 1171 E Mt Hood St
- 1269 E Mt Hood St
- 550 E Olympia St
- 1151 E Mt Hood St
- 425 N Desdemona Ave
- 620 N Larkspur Ln
- 245 E Cedar St
- 205 E Cedar St
- 1525 E Catalpa St
Your Personal Tour Guide
Ask me questions while you tour the home.