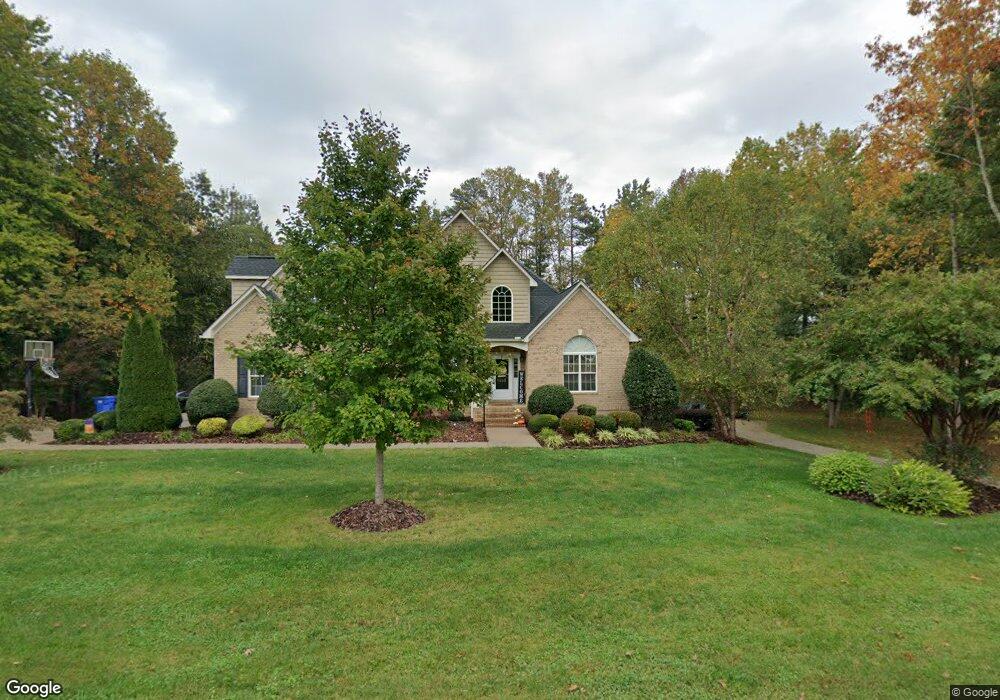
1255 Glenfield Dr Salisbury, NC 28147
Estimated Value: $531,000 - $667,994
--
Bed
3
Baths
2,269
Sq Ft
$260/Sq Ft
Est. Value
About This Home
This home is located at 1255 Glenfield Dr, Salisbury, NC 28147 and is currently estimated at $589,499, approximately $259 per square foot. 1255 Glenfield Dr is a home located in Rowan County with nearby schools including Hurley Elementary School, West Rowan Middle School, and West Rowan High School.
Ownership History
Date
Name
Owned For
Owner Type
Purchase Details
Closed on
Oct 28, 2021
Sold by
Gaskill Scott A and Gaskill Karen B
Bought by
Ijames Benjamin L and Ijames Jessica G
Current Estimated Value
Home Financials for this Owner
Home Financials are based on the most recent Mortgage that was taken out on this home.
Original Mortgage
$360,000
Outstanding Balance
$328,998
Interest Rate
2.8%
Mortgage Type
New Conventional
Estimated Equity
$260,501
Purchase Details
Closed on
Jul 29, 2008
Sold by
Gaskill Scott A and Gaskill Karen B
Bought by
Gaskill Scott A and Gaskill Karen B
Purchase Details
Closed on
Aug 14, 2006
Sold by
Plantation Ridge
Bought by
Gaskill Scott A and Gaskill Karen B
Home Financials for this Owner
Home Financials are based on the most recent Mortgage that was taken out on this home.
Original Mortgage
$224,700
Interest Rate
6.73%
Mortgage Type
Unknown
Create a Home Valuation Report for This Property
The Home Valuation Report is an in-depth analysis detailing your home's value as well as a comparison with similar homes in the area
Home Values in the Area
Average Home Value in this Area
Purchase History
| Date | Buyer | Sale Price | Title Company |
|---|---|---|---|
| Ijames Benjamin L | $600,000 | None Available | |
| Gaskill Scott A | -- | None Available | |
| Gaskill Scott A | $281,000 | Chicago Title Insurance Co |
Source: Public Records
Mortgage History
| Date | Status | Borrower | Loan Amount |
|---|---|---|---|
| Open | Ijames Benjamin L | $360,000 | |
| Previous Owner | Gaskill Scott A | $224,700 |
Source: Public Records
Tax History Compared to Growth
Tax History
| Year | Tax Paid | Tax Assessment Tax Assessment Total Assessment is a certain percentage of the fair market value that is determined by local assessors to be the total taxable value of land and additions on the property. | Land | Improvement |
|---|---|---|---|---|
| 2025 | $3,746 | $552,856 | $73,920 | $478,936 |
| 2024 | $3,746 | $552,856 | $73,920 | $478,936 |
| 2023 | $3,746 | $552,856 | $73,920 | $478,936 |
| 2022 | $2,361 | $312,714 | $64,680 | $248,034 |
| 2021 | $2,338 | $312,714 | $64,680 | $248,034 |
| 2020 | $2,338 | $312,714 | $64,680 | $248,034 |
| 2019 | $2,338 | $312,714 | $64,680 | $248,034 |
| 2018 | $2,090 | $281,906 | $64,680 | $217,226 |
| 2017 | $2,090 | $281,906 | $64,680 | $217,226 |
| 2016 | $2,090 | $281,906 | $64,680 | $217,226 |
| 2015 | $2,114 | $281,906 | $64,680 | $217,226 |
| 2014 | $2,021 | $282,658 | $63,000 | $219,658 |
Source: Public Records
Map
Nearby Homes
- 260 Cameron Dr
- 617 Autumnlight Dr
- 3.24 AC Sherrills Ford Rd
- 415 Autumnlight Dr
- 202 Windmill Rd
- 0 Windmill Rd
- 115 Pinewood Dr
- 308 Home Rd
- 335 Neel Rd
- 2220 Mooresville Rd
- 2218 Mooresville Rd
- 280 Bonaventure Dr
- 325 Bonaventure Dr
- Barkley II Plan at Grants Landing - Meadows
- Calderwood Plan at Grants Landing - Meadows
- Woodruff II Plan at Grants Landing - Meadows
- Mitchell Plan at Grants Landing - Meadows
- Harding Plan at Grants Landing - Meadows
- Caldwell Plan at Grants Landing - Meadows
- Kephart Plan at Grants Landing - Meadows
- 1260 Glenfield Dr
- 1230 Glenfield Dr
- 1310 Glenfield Dr
- 1173 Glenfield Dr
- 1173 Glenfield Dr Unit 34,35,36
- 467 Cameron Dr
- 443 Cameron Dr
- 1170 Glenfield Dr
- 1351 Glenfield Dr
- 1350 Glenfield Dr
- 468 Cameron Dr
- 387 Cameron Dr
- 1141 Glenfield Dr
- 1138 Glenfield Dr
- 432 Cameron Dr
- 402 Cameron Dr
- 359 Cameron Dr
- 1415 Glenfield Dr
- 465 Baxx Dr
- 1110 Glenfield Dr