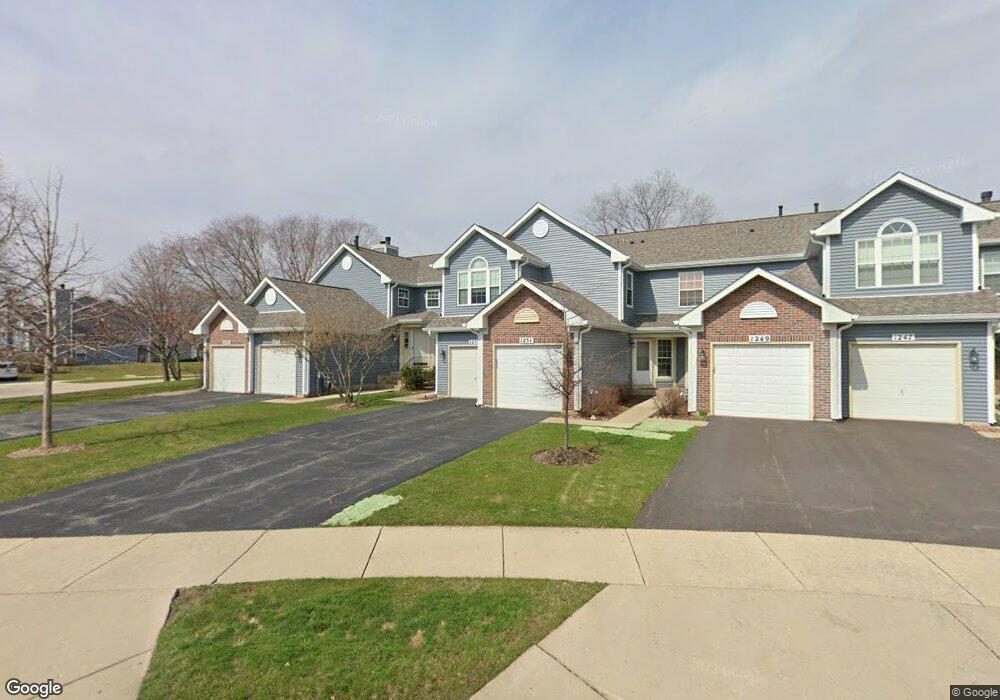
1255 Hathaway Cir Unit 172 Elgin, IL 60120
Cobblers Crossing NeighborhoodEstimated Value: $217,008 - $261,000
2
Beds
--
Bath
1,150
Sq Ft
$212/Sq Ft
Est. Value
About This Home
This home is located at 1255 Hathaway Cir Unit 172, Elgin, IL 60120 and is currently estimated at $244,002, approximately $212 per square foot. 1255 Hathaway Cir Unit 172 is a home located in Cook County with nearby schools including Lincoln Elementary School, Larsen Middle School, and Elgin High School.
Ownership History
Date
Name
Owned For
Owner Type
Purchase Details
Closed on
Jul 19, 2002
Sold by
Chrysty Dawn R
Bought by
Thiede Gail S
Current Estimated Value
Home Financials for this Owner
Home Financials are based on the most recent Mortgage that was taken out on this home.
Original Mortgage
$128,000
Outstanding Balance
$54,608
Interest Rate
6.8%
Estimated Equity
$189,394
Purchase Details
Closed on
Jun 28, 1999
Sold by
Conty Mary
Bought by
Christy Dawn R
Home Financials for this Owner
Home Financials are based on the most recent Mortgage that was taken out on this home.
Original Mortgage
$107,000
Interest Rate
7.29%
Purchase Details
Closed on
May 26, 1994
Sold by
Cobblers Crossing Country Homes North Lt
Bought by
Conty Mary
Home Financials for this Owner
Home Financials are based on the most recent Mortgage that was taken out on this home.
Original Mortgage
$81,000
Interest Rate
8.48%
Create a Home Valuation Report for This Property
The Home Valuation Report is an in-depth analysis detailing your home's value as well as a comparison with similar homes in the area
Home Values in the Area
Average Home Value in this Area
Purchase History
| Date | Buyer | Sale Price | Title Company |
|---|---|---|---|
| Thiede Gail S | $138,000 | Stewart Title Guaranty Compa | |
| Christy Dawn R | $110,500 | -- | |
| Conty Mary | $101,500 | Intercounty Title |
Source: Public Records
Mortgage History
| Date | Status | Borrower | Loan Amount |
|---|---|---|---|
| Open | Thiede Gail S | $128,000 | |
| Previous Owner | Christy Dawn R | $107,000 | |
| Previous Owner | Conty Mary | $81,000 |
Source: Public Records
Tax History Compared to Growth
Tax History
| Year | Tax Paid | Tax Assessment Tax Assessment Total Assessment is a certain percentage of the fair market value that is determined by local assessors to be the total taxable value of land and additions on the property. | Land | Improvement |
|---|---|---|---|---|
| 2024 | $3,406 | $15,148 | $1,759 | $13,389 |
| 2023 | $3,280 | $15,148 | $1,759 | $13,389 |
| 2022 | $3,280 | $15,148 | $1,759 | $13,389 |
| 2021 | $2,614 | $10,916 | $1,130 | $9,786 |
| 2020 | $2,676 | $10,916 | $1,130 | $9,786 |
| 2019 | $2,682 | $12,179 | $1,130 | $11,049 |
| 2018 | $1,780 | $8,675 | $1,004 | $7,671 |
| 2017 | $1,795 | $8,675 | $1,004 | $7,671 |
| 2016 | $1,969 | $8,675 | $1,004 | $7,671 |
| 2015 | $1,851 | $7,893 | $879 | $7,014 |
| 2014 | $1,812 | $7,893 | $879 | $7,014 |
| 2013 | $1,732 | $7,893 | $879 | $7,014 |
Source: Public Records
Map
Nearby Homes
- 1212 Shawford Way Unit 17
- 1104 Loganbury Ct Unit 33211
- 6099 Canterbury Ln Unit 302
- 6073 Canterbury Ln Unit 335
- 1080 Wakefield Dr
- 1818 Kelberg Ave
- 1816 Kelberg Ave Unit 484
- Vacant Lot Parcel 1 Congdon Ave
- 6034 Delaney Dr Unit 171
- 796 Parkway Ave
- 1870 Hampshire Dr
- 1102 Coldspring Rd
- 904 Chippewa Dr
- 1103 Hiawatha Dr
- 1152 Hiawatha Dr
- 879 Dandridge Ct
- 1409 Dundee Ave
- 930 Jefferson Ave
- 2221 Edgartown Ln
- 1798 Newberry Ln
- 1257 Hathaway Cir Unit 171
- 1253 Hathaway Cir Unit 173
- 1251 Hathaway Cir Unit 174
- 1249 Hathaway Cir Unit 175
- 1247 Hathaway Cir Unit 176
- 1307 Providence Cir Unit 163
- 1305 Providence Cir Unit 164
- 1309 Providence Cir Unit 162
- 1303 Providence Cir Unit 165
- 1311 Providence Cir Unit 161
- 1301 Providence Cir Unit 166
- 1243 Hathaway Cir Unit 181
- 1241 Hathaway Cir Unit 182
- 1239 Hathaway Cir Unit 183
- 1260 Christopher Ct Unit 41
- 1237 Hathaway Cir Unit 184
- 1315 Providence Cir Unit 156
- 1235 Hathaway Cir Unit 185
- 1244 Shawford Way Unit 35
- 1246 Shawford Way Unit 36