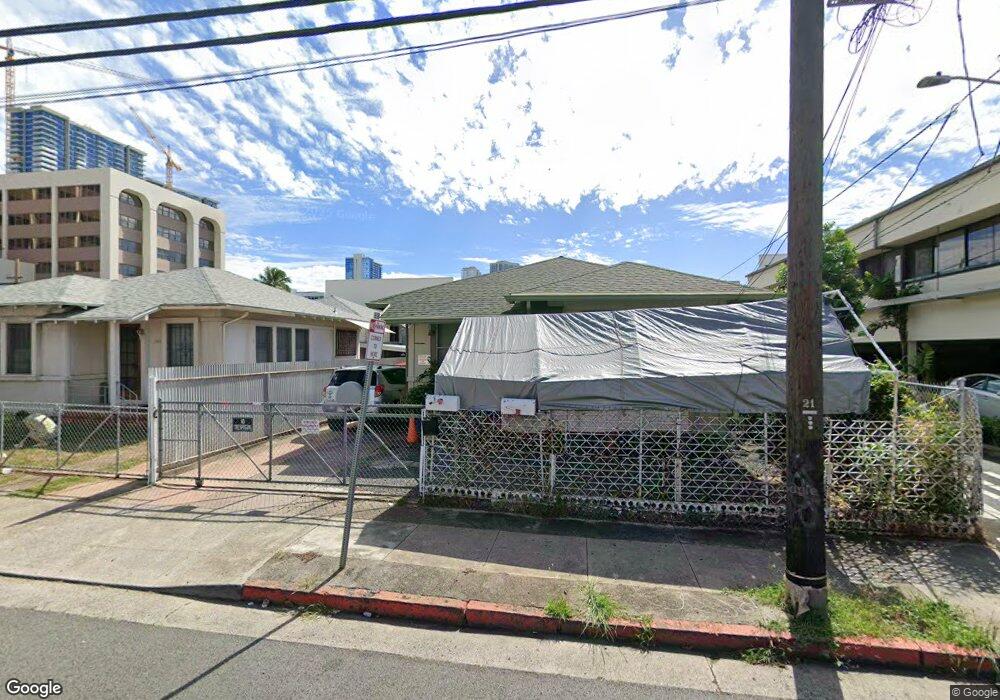
1255 Young St Unit A Honolulu, HI 96814
Makiki NeighborhoodEstimated Value: $1,150,204 - $1,337,000
3
Beds
2
Baths
1,116
Sq Ft
$1,113/Sq Ft
Est. Value
About This Home
This home is located at 1255 Young St Unit A, Honolulu, HI 96814 and is currently estimated at $1,242,051, approximately $1,112 per square foot. 1255 Young St Unit A is a home located in Honolulu County with nearby schools including Queen Ka'ahumanu Elementary School, President William McKinley High School, and St. Clement's School.
Ownership History
Date
Name
Owned For
Owner Type
Purchase Details
Closed on
Aug 28, 2023
Sold by
Doan Reed Donna
Bought by
Doan Reed Donna and Mai Aiello Diann
Current Estimated Value
Purchase Details
Closed on
Jan 19, 2007
Sold by
Nose Lisa Yongson Yi
Bought by
Doan Reed Donna
Home Financials for this Owner
Home Financials are based on the most recent Mortgage that was taken out on this home.
Original Mortgage
$575,000
Interest Rate
6.16%
Mortgage Type
Unknown
Purchase Details
Closed on
Nov 6, 2006
Sold by
Fujitani Wayne T and Fujitani Carol T
Bought by
Nose Lisa Yongson Yi
Home Financials for this Owner
Home Financials are based on the most recent Mortgage that was taken out on this home.
Original Mortgage
$560,000
Interest Rate
6.3%
Mortgage Type
New Conventional
Create a Home Valuation Report for This Property
The Home Valuation Report is an in-depth analysis detailing your home's value as well as a comparison with similar homes in the area
Home Values in the Area
Average Home Value in this Area
Purchase History
| Date | Buyer | Sale Price | Title Company |
|---|---|---|---|
| Doan Reed Donna | -- | None Listed On Document | |
| Doan Reed Donna | $810,000 | Or | |
| Nose Lisa Yongson Yi | $700,000 | None Available |
Source: Public Records
Mortgage History
| Date | Status | Borrower | Loan Amount |
|---|---|---|---|
| Previous Owner | Doan Reed Donna | $575,000 | |
| Previous Owner | Nose Lisa Yongson Yi | $560,000 |
Source: Public Records
Tax History Compared to Growth
Tax History
| Year | Tax Paid | Tax Assessment Tax Assessment Total Assessment is a certain percentage of the fair market value that is determined by local assessors to be the total taxable value of land and additions on the property. | Land | Improvement |
|---|---|---|---|---|
| 2025 | $3,590 | $1,302,100 | $1,106,200 | $195,900 |
| 2024 | $3,590 | $1,185,700 | $965,400 | $220,300 |
| 2023 | $3,010 | $1,100,100 | $955,300 | $144,800 |
| 2022 | $3,000 | $997,200 | $844,700 | $152,500 |
| 2021 | $2,596 | $881,700 | $771,000 | $110,700 |
| 2020 | $2,976 | $990,300 | $787,700 | $202,600 |
| 2019 | $3,100 | $1,005,800 | $754,200 | $251,600 |
| 2018 | $2,603 | $863,600 | $754,200 | $109,400 |
| 2017 | $2,884 | $904,000 | $670,400 | $233,600 |
| 2016 | $2,325 | $744,200 | $623,500 | $120,700 |
| 2015 | $2,575 | $815,800 | $569,800 | $246,000 |
| 2014 | $1,612 | $553,400 | $502,800 | $50,600 |
Source: Public Records
Map
Nearby Homes
- 827 Alder St
- 1125 Young St Unit 503
- 1314 Piikoi St Unit 706
- 1268 Rycroft St Unit B
- 1515 Liona St Unit 2618
- 1515 Liona St Unit 1801
- 1515 Liona St Unit 1604
- 1515 Liona St Unit 4407
- 1515 Liona St Unit 2603
- 1515 Liona St Unit 3202
- 1515 Liona St Unit 3619
- 1515 Liona St Unit 4318
- 1515 Liona St Unit 2903
- 1515 Liona St Unit 3400
- 1515 Liona St Unit 3302
- 1515 Liona St Unit 1802
- 1515 Liona St Unit 2100
- 1515 Liona St Unit 2308
- 1515 Liona St Unit 3507
- 1515 Liona St Unit 2718
- 1259 Young St
- 1022 Akala Ln Unit 207
- 1022 Akala Ln
- 1267 Young St
- 1013 Akala Ln
- 1016 Akoko St
- 1012 Akala Ln
- 1260 Young St
- 1233 Young St Unit 303
- 1233 Young St
- 1008 Akoko St
- 1250 S King St
- 1018 Palm Dr
- 1270 Young St
- 1229 Young St
- 1302 Young St
- 1302 Young St Unit B
- 1302 Young St Unit D
- 1302 Young St Unit A
- 1012 Akoko St