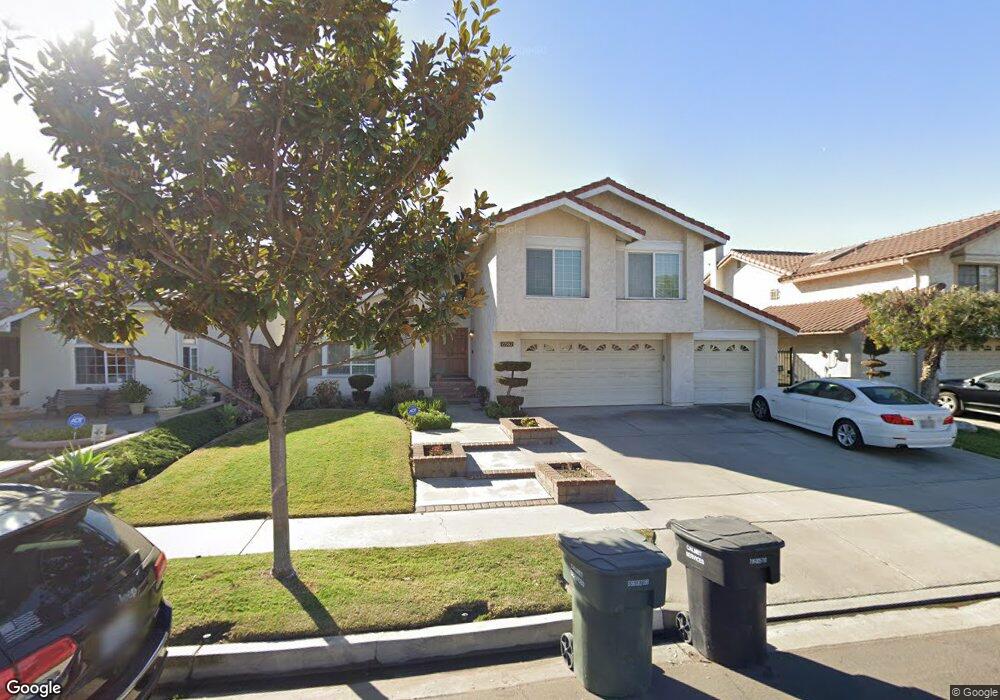
12552 Corellian Ct Cerritos, CA 90703
Estimated Value: $1,451,000 - $1,531,000
4
Beds
3
Baths
2,753
Sq Ft
$542/Sq Ft
Est. Value
About This Home
This home is located at 12552 Corellian Ct, Cerritos, CA 90703 and is currently estimated at $1,491,034, approximately $541 per square foot. 12552 Corellian Ct is a home located in Los Angeles County with nearby schools including Carver Elementary School, Tetzlaff (Martin B.) Middle School, and Cerritos High School.
Ownership History
Date
Name
Owned For
Owner Type
Purchase Details
Closed on
Apr 2, 2008
Sold by
Wiguna Sharif
Bought by
Wiguna Sharif W and Wiguna Swanny
Current Estimated Value
Purchase Details
Closed on
Jul 25, 1998
Sold by
Wiguna Sharif
Bought by
Wiguna Sharif and Wiguna Swanny
Purchase Details
Closed on
Jan 30, 1998
Sold by
Francisco Santiago N
Bought by
Wiguna Sharif and Widuna Swanny
Home Financials for this Owner
Home Financials are based on the most recent Mortgage that was taken out on this home.
Original Mortgage
$257,000
Interest Rate
7.11%
Create a Home Valuation Report for This Property
The Home Valuation Report is an in-depth analysis detailing your home's value as well as a comparison with similar homes in the area
Home Values in the Area
Average Home Value in this Area
Purchase History
| Date | Buyer | Sale Price | Title Company |
|---|---|---|---|
| Wiguna Sharif W | -- | None Available | |
| Wiguna Sharif | -- | -- | |
| Wiguna Sharif | $399,000 | Chicago Title Co |
Source: Public Records
Mortgage History
| Date | Status | Borrower | Loan Amount |
|---|---|---|---|
| Previous Owner | Wiguna Sharif | $257,000 |
Source: Public Records
Tax History Compared to Growth
Tax History
| Year | Tax Paid | Tax Assessment Tax Assessment Total Assessment is a certain percentage of the fair market value that is determined by local assessors to be the total taxable value of land and additions on the property. | Land | Improvement |
|---|---|---|---|---|
| 2025 | $8,112 | $677,945 | $215,388 | $462,557 |
| 2024 | $8,112 | $664,653 | $211,165 | $453,488 |
| 2023 | $7,848 | $651,622 | $207,025 | $444,597 |
| 2022 | $7,729 | $638,846 | $202,966 | $435,880 |
| 2021 | $7,540 | $626,321 | $198,987 | $427,334 |
| 2019 | $7,366 | $607,746 | $193,086 | $414,660 |
| 2018 | $6,809 | $595,830 | $189,300 | $406,530 |
| 2016 | $6,526 | $572,695 | $181,950 | $390,745 |
| 2015 | $6,443 | $564,093 | $179,217 | $384,876 |
| 2014 | $6,312 | $553,044 | $175,707 | $377,337 |
Source: Public Records
Map
Nearby Homes
- 19657 Sequoia Ave
- 19335 Derbyshire Ln
- 12711 Castleford Ln
- 12967 Moorshire Dr
- 12251 Carver Ln
- 7862 Squaw Valley Way
- 12361 Caravel Place
- 19008 Jeffrey Ave
- 12523 Lemming St
- 4322 Fontainbleau Ave
- 12360 Hedda Dr
- 19528 Ray Cir
- 4372 Opal Ave
- 19518 Nancy Cir
- 12750 Centralia St Unit 24
- 12750 Centralia St Unit 191
- 12750 Centralia St Unit 159
- 12750 Centralia St Unit 94
- 4502 Petite Ln
- 19118 Martha Ave
- 12558 Corellian Ct
- 12546 Corellian Ct
- 12567 Valencia St
- 12573 Valencia St
- 12540 Corellian Ct
- 12563 Valencia St
- 12577 Valencia St
- 12557 Valencia St
- 12551 Corellian Ct
- 12545 Corellian Ct
- 12534 Corellian Ct
- 12557 Corellian Ct
- 12551 Valencia St
- 12539 Corellian Ct
- 12566 Valencia St
- 12572 Valencia St
- 12526 Corellian Ct
- 12562 Valencia St
- 12545 Valencia St
- 12533 Corellian Ct