Estimated Value: $181,000 - $302,000
2
Beds
1
Bath
1,098
Sq Ft
$212/Sq Ft
Est. Value
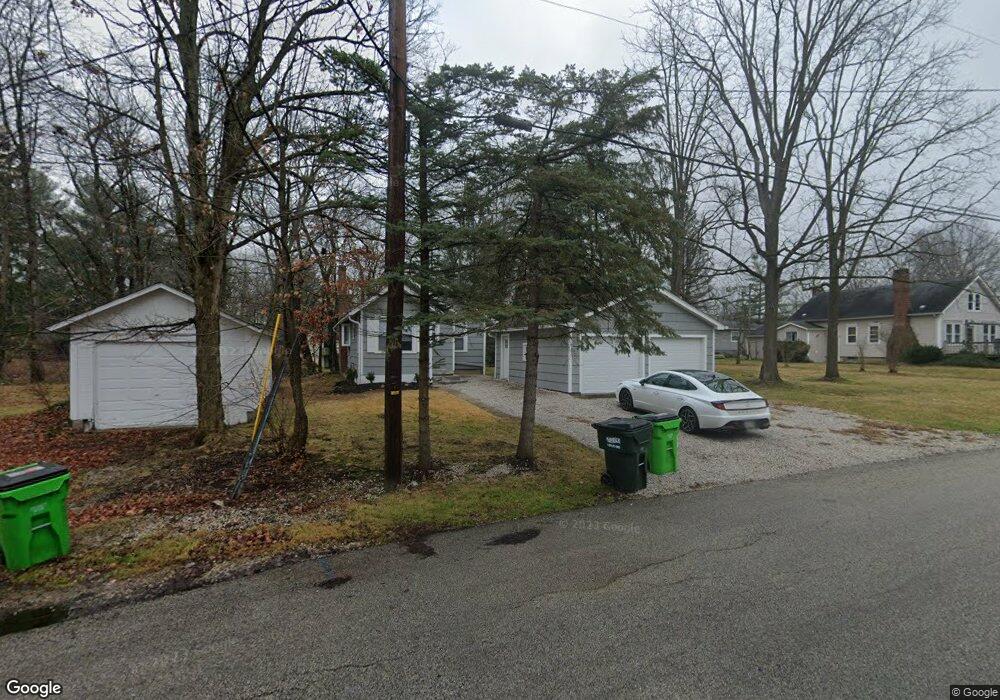
About This Home
This home is located at 1257 Chestnut Dr, Stow, OH 44224 and is currently estimated at $232,372, approximately $211 per square foot. 1257 Chestnut Dr is a home located in Summit County with nearby schools including Stow-Munroe Falls High School, Primrose School of Hudson, and Holy Family Elementary School.
Ownership History
Date
Name
Owned For
Owner Type
Purchase Details
Closed on
Dec 4, 2021
Sold by
Twin Hill Propertie Llc
Bought by
Giffels Evan D
Current Estimated Value
Home Financials for this Owner
Home Financials are based on the most recent Mortgage that was taken out on this home.
Original Mortgage
$206,150
Outstanding Balance
$189,553
Interest Rate
3.09%
Mortgage Type
New Conventional
Estimated Equity
$42,819
Purchase Details
Closed on
Apr 12, 2021
Sold by
Living Water Properties Llc
Bought by
Twin Hill Properties Llc
Purchase Details
Closed on
Dec 18, 2020
Sold by
Chadwick Christopher M
Bought by
Living Water Properties Llc
Purchase Details
Closed on
Feb 25, 2010
Sold by
Kaforey Ellen C
Bought by
Chadwick Christopher M
Home Financials for this Owner
Home Financials are based on the most recent Mortgage that was taken out on this home.
Original Mortgage
$46,400
Interest Rate
5.11%
Mortgage Type
New Conventional
Create a Home Valuation Report for This Property
The Home Valuation Report is an in-depth analysis detailing your home's value as well as a comparison with similar homes in the area
Home Values in the Area
Average Home Value in this Area
Purchase History
| Date | Buyer | Sale Price | Title Company |
|---|---|---|---|
| Giffels Evan D | $217,000 | Fireland Title | |
| Twin Hill Properties Llc | $78,000 | None Available | |
| Living Water Properties Llc | $58,000 | Fireland Title | |
| Chadwick Christopher M | $58,000 | None Available |
Source: Public Records
Mortgage History
| Date | Status | Borrower | Loan Amount |
|---|---|---|---|
| Open | Giffels Evan D | $206,150 | |
| Previous Owner | Chadwick Christopher M | $46,400 |
Source: Public Records
Tax History Compared to Growth
Tax History
| Year | Tax Paid | Tax Assessment Tax Assessment Total Assessment is a certain percentage of the fair market value that is determined by local assessors to be the total taxable value of land and additions on the property. | Land | Improvement |
|---|---|---|---|---|
| 2025 | $3,180 | $54,688 | $7,067 | $47,621 |
| 2024 | $3,180 | $54,688 | $7,067 | $47,621 |
| 2023 | $3,180 | $54,688 | $7,067 | $47,621 |
| 2022 | $2,639 | $40,916 | $5,233 | $35,683 |
| 2021 | $1,843 | $31,648 | $5,233 | $26,415 |
| 2020 | $1,812 | $31,650 | $5,230 | $26,420 |
| 2019 | $1,213 | $19,480 | $7,870 | $11,610 |
| 2018 | $1,194 | $19,480 | $7,870 | $11,610 |
| 2017 | $1,343 | $19,480 | $7,870 | $11,610 |
| 2016 | $1,261 | $19,480 | $7,870 | $11,610 |
| 2015 | $1,343 | $19,480 | $7,870 | $11,610 |
| 2014 | $1,362 | $19,480 | $7,870 | $11,610 |
| 2013 | $1,359 | $20,770 | $7,870 | $12,900 |
Source: Public Records
Map
Nearby Homes
- 1470 Mac Dr
- 0 Hibbard Dr
- V/L Lawnmark Dr
- 4891 Cedar Crest Ln
- 4877 Cedar Crest Ln
- 1511 Apollo Dr
- 1664 Cypress Ct
- 1808 Higby Dr Unit A
- 1627 Cypress Ct
- V/L Housley Rd
- 1938 Higby Dr
- 1620 Sapphire Dr
- 4630 Red Willow Rd
- 1759 E Sapphire Dr
- 1884 Village Ct Unit X66
- V/L Norton Rd
- 734 Barlow Rd
- 5426 Port Chester Dr
- 5217 Beckett Ridge
- V/L Diplomat Dr
- 1249 Chestnut Dr
- 1249 Chestnut Dr
- 1244 Chestnut Dr
- 1245 Chestnut Dr
- 1259 Meadowbrook Blvd
- 1241 Chestnut Dr
- 1236 Chestnut Dr
- 1269 Chestnut Dr
- 1239 Meadowbrook Blvd
- 4864 Elmway Dr
- 4860 Elmway Dr
- 1237 Chestnut Dr
- 1230 Chestnut Dr
- 1233 Chestnut Dr
- 1263 Meadowbrook Blvd
- 1271 Meadowbrook Blvd
- 1231 Meadowbrook Blvd
- 1229 Chestnut Dr
- 4865 Elmway Dr
- 1222 Chestnut Dr