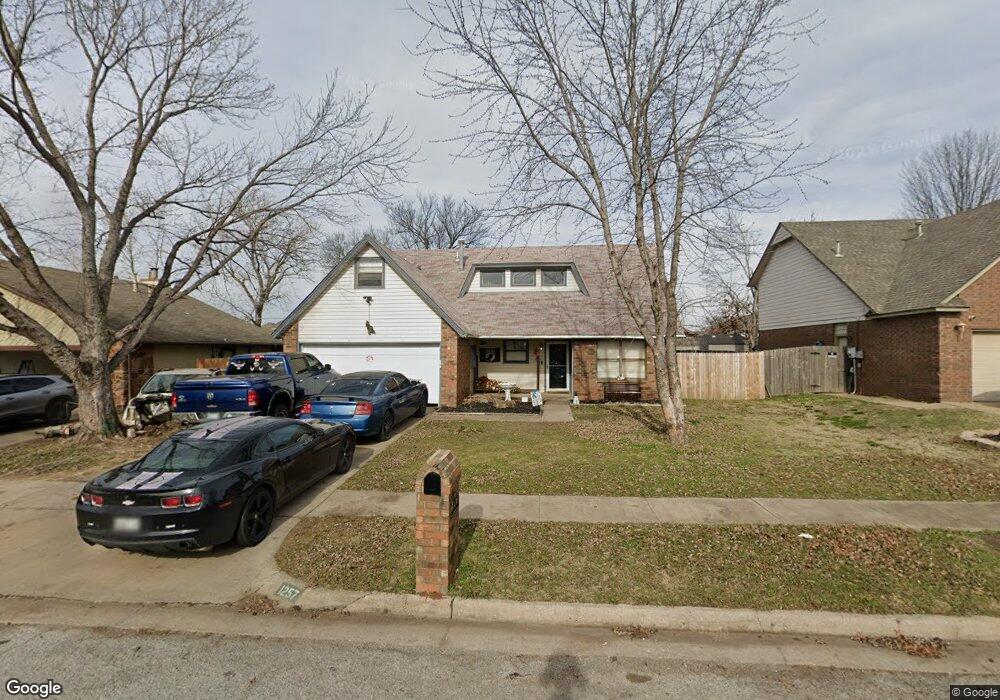
1257 E 136th St Glenpool, OK 74033
Estimated Value: $264,467 - $292,000
4
Beds
2
Baths
2,240
Sq Ft
$124/Sq Ft
Est. Value
About This Home
This home is located at 1257 E 136th St, Glenpool, OK 74033 and is currently estimated at $278,367, approximately $124 per square foot. 1257 E 136th St is a home located in Tulsa County with nearby schools including Glenpool Elementary School, Glenpool Middle School, and Glenpool High School.
Ownership History
Date
Name
Owned For
Owner Type
Purchase Details
Closed on
Dec 12, 2006
Sold by
Lindsey Kevin E and Lindsey Sharon P
Bought by
Hand Eugene and Hand Debbie
Current Estimated Value
Home Financials for this Owner
Home Financials are based on the most recent Mortgage that was taken out on this home.
Original Mortgage
$150,000
Outstanding Balance
$101,311
Interest Rate
8.99%
Mortgage Type
Purchase Money Mortgage
Estimated Equity
$177,056
Purchase Details
Closed on
Jun 28, 2005
Sold by
Mccombs Mandie and Stump Mandie
Bought by
Stump James Lee
Purchase Details
Closed on
Dec 14, 2004
Sold by
Kofr Kimberly Christine and Sutton Kim C
Bought by
Stump James L
Home Financials for this Owner
Home Financials are based on the most recent Mortgage that was taken out on this home.
Original Mortgage
$105,600
Interest Rate
5.7%
Mortgage Type
Purchase Money Mortgage
Create a Home Valuation Report for This Property
The Home Valuation Report is an in-depth analysis detailing your home's value as well as a comparison with similar homes in the area
Home Values in the Area
Average Home Value in this Area
Purchase History
| Date | Buyer | Sale Price | Title Company |
|---|---|---|---|
| Hand Eugene | $150,000 | Firstitle & Abstract Service | |
| Stump James Lee | -- | -- | |
| Stump James L | $132,000 | -- |
Source: Public Records
Mortgage History
| Date | Status | Borrower | Loan Amount |
|---|---|---|---|
| Open | Hand Eugene | $150,000 | |
| Previous Owner | Stump James L | $105,600 | |
| Closed | Stump James L | $26,400 |
Source: Public Records
Tax History
| Year | Tax Paid | Tax Assessment Tax Assessment Total Assessment is a certain percentage of the fair market value that is determined by local assessors to be the total taxable value of land and additions on the property. | Land | Improvement |
|---|---|---|---|---|
| 2025 | $2,107 | $17,571 | $1,563 | $16,008 |
| 2024 | $1,932 | $17,030 | $1,575 | $15,455 |
| 2023 | $1,932 | $17,505 | $1,784 | $15,721 |
| 2022 | $1,843 | $15,995 | $2,079 | $13,916 |
| 2021 | $1,814 | $15,500 | $2,015 | $13,485 |
| 2020 | $1,827 | $15,500 | $2,015 | $13,485 |
| 2019 | $1,840 | $15,500 | $2,015 | $13,485 |
| 2018 | $1,832 | $15,500 | $2,015 | $13,485 |
| 2017 | $1,793 | $16,500 | $2,145 | $14,355 |
| 2016 | $1,811 | $16,500 | $2,145 | $14,355 |
| 2015 | $1,801 | $16,500 | $2,145 | $14,355 |
| 2014 | $1,810 | $16,500 | $2,145 | $14,355 |
Source: Public Records
Map
Nearby Homes
- 13503 S Oak Ct
- 1211 E 135th St
- 13761 S Nyssa Ct
- 1024 E 135th Place
- 13773 S Oak Place
- 13796 S Nyssa Place
- 1104 E 137th St
- 13674 S Maple St
- 13324 S Poplar St
- 2355 E 135th Place
- 1664 E 138th St S
- 1171 E 133rd St
- 1671 E 140th St
- 1543 E 137th Place
- 13672 S Kenosha Ave
- 1665 E 138th Place S
- 13816 S Iroquois Ave E
- 243 E 141st St
- 14969 S Poplar Place
- 15013 S Oak St
- 1261 E 136th St
- 1243 E 136th St
- 13511 S Oak St
- 1275 E 136th St
- 13512 S Oak St
- 13619 S Nyssa Ct
- 13618 S Oak St
- 13515 S Nyssa Ct
- 13509 S Oak St
- 1301 E 136th St
- 13510 S Oak Ct
- 13638 S Oak St
- 13588 S Nyssa Ct
- 13639 S Nyssa Ct
- 13598 S Nyssa Ct
- 13508 S Oak St
- 13620 S Nyssa Ct
- 13621 S Oak St
- 13505 S Oak St
- 1315 E 136th St
Your Personal Tour Guide
Ask me questions while you tour the home.