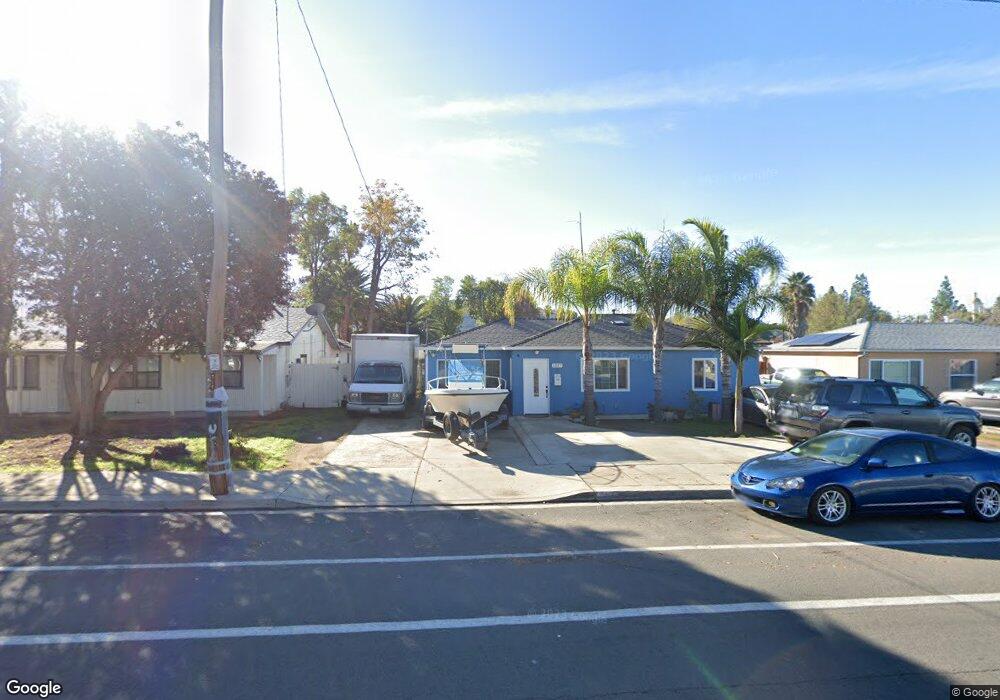
1257 E Lexington Ave El Cajon, CA 92019
Estimated Value: $792,000 - $960,000
4
Beds
2
Baths
2,076
Sq Ft
$424/Sq Ft
Est. Value
About This Home
This home is located at 1257 E Lexington Ave, El Cajon, CA 92019 and is currently estimated at $881,096, approximately $424 per square foot. 1257 E Lexington Ave is a home located in San Diego County with nearby schools including Lexington Elementary School, Montgomery Middle School, and El Cajon Valley High School.
Ownership History
Date
Name
Owned For
Owner Type
Purchase Details
Closed on
Oct 1, 2008
Sold by
Zeno Harold
Bought by
Torres Alpide Ismael and Bahena Rosa M
Current Estimated Value
Home Financials for this Owner
Home Financials are based on the most recent Mortgage that was taken out on this home.
Original Mortgage
$296,235
Outstanding Balance
$195,852
Interest Rate
6.31%
Mortgage Type
VA
Estimated Equity
$685,244
Purchase Details
Closed on
Sep 26, 2006
Sold by
Dokulil Sandra
Bought by
Dokulil Jay A
Home Financials for this Owner
Home Financials are based on the most recent Mortgage that was taken out on this home.
Original Mortgage
$90,000
Interest Rate
6.18%
Mortgage Type
Stand Alone Second
Purchase Details
Closed on
Sep 12, 2006
Sold by
Dokulil Jay A and Dokulil Jeri R
Bought by
Zeno Harold
Home Financials for this Owner
Home Financials are based on the most recent Mortgage that was taken out on this home.
Original Mortgage
$90,000
Interest Rate
6.18%
Mortgage Type
Stand Alone Second
Create a Home Valuation Report for This Property
The Home Valuation Report is an in-depth analysis detailing your home's value as well as a comparison with similar homes in the area
Purchase History
| Date | Buyer | Sale Price | Title Company |
|---|---|---|---|
| Torres Alpide Ismael | $290,000 | Ticor Title | |
| Dokulil Jay A | -- | Chicago Title Co | |
| Zeno Harold | $450,000 | Chicago Title Co |
Source: Public Records
Mortgage History
| Date | Status | Borrower | Loan Amount |
|---|---|---|---|
| Open | Torres Alpide Ismael | $296,235 | |
| Previous Owner | Dokulil Jay A | $90,000 | |
| Previous Owner | Zeno Harold | $360,000 |
Source: Public Records
Tax History
| Year | Tax Paid | Tax Assessment Tax Assessment Total Assessment is a certain percentage of the fair market value that is determined by local assessors to be the total taxable value of land and additions on the property. | Land | Improvement |
|---|---|---|---|---|
| 2025 | $5,295 | $373,434 | $160,962 | $212,472 |
| 2024 | $5,295 | $366,112 | $157,806 | $208,306 |
| 2023 | $5,336 | $358,934 | $154,712 | $204,222 |
| 2022 | $5,165 | $351,897 | $151,679 | $200,218 |
| 2021 | $5,158 | $344,998 | $148,705 | $196,293 |
| 2020 | $5,119 | $341,462 | $147,181 | $194,281 |
| 2019 | $4,108 | $334,768 | $144,296 | $190,472 |
| 2018 | $4,042 | $328,205 | $141,467 | $186,738 |
| 2017 | $30 | $321,771 | $138,694 | $183,077 |
| 2016 | $3,831 | $315,463 | $135,975 | $179,488 |
| 2015 | $3,812 | $310,725 | $133,933 | $176,792 |
| 2014 | $3,738 | $304,639 | $131,310 | $173,329 |
Source: Public Records
Map
Nearby Homes
- 345 S 2nd St
- 212 S 2nd St Unit 10
- 212 S 2nd St
- 212 S 2nd St Unit 60
- 255 S 2nd St Unit 6
- 187 Ballard St Unit 62
- 187 Ballard St Unit 15
- 187 Ballard St Unit 133
- 1194 Andover Rd
- 1160 E Lexington Ave Unit 6
- 1170 Decker St Unit D
- 1164 Decker St Unit A
- 1155 E Main St Unit 12
- 1160 E Washington Ave Unit 3
- 357 S 1st St
- 667 Alderson St
- 244 Shady Ln Unit 44
- 716 S 2nd St Unit 197
- 716 S 2nd St Unit 175
- 1174 E Main St Unit 62
- 1253 E Lexington Ave
- 1261 E Lexington Ave
- 1265 E Lexington Ave
- 1249 E Lexington Ave
- 1269 E Lexington Ave
- 1245 E Lexington Ave
- 1258 Redwood Ave
- 1254 Redwood Ave
- 1262 Redwood Ave
- 1266 Redwood Ave
- 1250 Redwood Ave
- 1273 E Lexington Ave
- 1241 E Lexington Ave
- 1256 E Lexington Ave
- 1270 Redwood Ave
- 1246 Redwood Ave
- 1252 E Lexington Ave
- 1260 E Lexington Ave
- 1248 E Lexington Ave
- 1264 E Lexington Ave
Your Personal Tour Guide
Ask me questions while you tour the home.