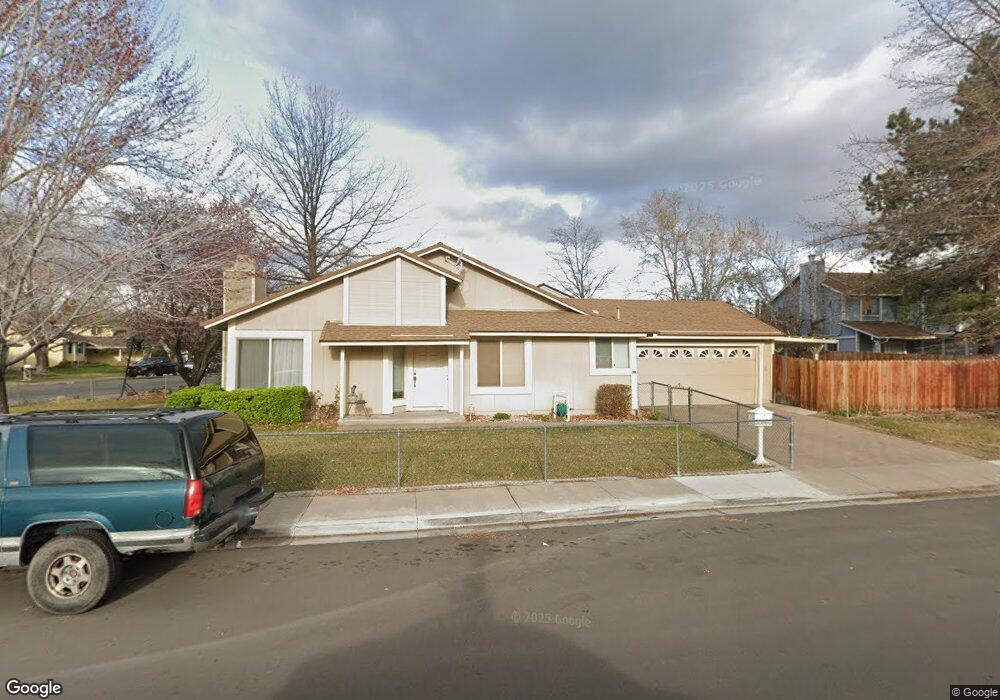
1257 Express St Sparks, NV 89434
O'Callaghan NeighborhoodEstimated Value: $370,000 - $413,000
2
Beds
2
Baths
1,252
Sq Ft
$306/Sq Ft
Est. Value
About This Home
This home is located at 1257 Express St, Sparks, NV 89434 and is currently estimated at $383,065, approximately $305 per square foot. 1257 Express St is a home located in Washoe County with nearby schools including Katherine Dunn Elementary School, George L Dilworth Middle School, and Edward C Reed High School.
Ownership History
Date
Name
Owned For
Owner Type
Purchase Details
Closed on
Jan 30, 2014
Sold by
Osterreicher Susan
Bought by
Susan Osterreicher Revocable Living Trus
Current Estimated Value
Purchase Details
Closed on
May 8, 2001
Sold by
Kerns Steven W and Kerns Anne B
Bought by
Osterreicher David L and Osterreicher Susan K
Home Financials for this Owner
Home Financials are based on the most recent Mortgage that was taken out on this home.
Original Mortgage
$89,800
Interest Rate
7.14%
Purchase Details
Closed on
Jun 15, 1995
Sold by
Interlicchia Michael D and Interlicchia Judith E
Bought by
Butterfield Kerns Steven W and Butterfield Kerns Anne
Home Financials for this Owner
Home Financials are based on the most recent Mortgage that was taken out on this home.
Original Mortgage
$90,000
Interest Rate
8.37%
Create a Home Valuation Report for This Property
The Home Valuation Report is an in-depth analysis detailing your home's value as well as a comparison with similar homes in the area
Home Values in the Area
Average Home Value in this Area
Purchase History
| Date | Buyer | Sale Price | Title Company |
|---|---|---|---|
| Susan Osterreicher Revocable Living Trus | -- | None Available | |
| Osterreicher David L | $130,000 | Stewart Title Northern Nevad | |
| Butterfield Kerns Steven W | $112,500 | Stewart Title |
Source: Public Records
Mortgage History
| Date | Status | Borrower | Loan Amount |
|---|---|---|---|
| Previous Owner | Osterreicher David L | $89,800 | |
| Previous Owner | Butterfield Kerns Steven W | $90,000 |
Source: Public Records
Tax History
| Year | Tax Paid | Tax Assessment Tax Assessment Total Assessment is a certain percentage of the fair market value that is determined by local assessors to be the total taxable value of land and additions on the property. | Land | Improvement |
|---|---|---|---|---|
| 2026 | -- | $56,182 | $30,380 | $25,802 |
| 2025 | $1,151 | $56,792 | $30,380 | $26,412 |
| 2024 | $1,118 | $53,345 | $25,725 | $27,620 |
| 2023 | $1,118 | $53,087 | $28,280 | $24,807 |
| 2022 | $1,095 | $46,762 | $25,060 | $21,702 |
| 2021 | $1,067 | $39,397 | $17,325 | $22,072 |
| 2020 | $1,033 | $39,675 | $17,150 | $22,525 |
| 2019 | $1,002 | $40,087 | $17,815 | $22,272 |
| 2018 | $974 | $34,133 | $12,110 | $22,023 |
| 2017 | $944 | $32,836 | $10,675 | $22,161 |
| 2016 | $919 | $31,909 | $9,240 | $22,669 |
| 2015 | $234 | $32,246 | $8,855 | $23,391 |
| 2014 | $983 | $29,534 | $6,825 | $22,709 |
| 2013 | -- | $27,508 | $5,040 | $22,468 |
Source: Public Records
Map
Nearby Homes
- 1218 Junction Dr
- 1308 Coachman Dr
- 1544 Woodhaven Ln
- 1655 Sabatino Dr
- 1674 Sabatino Dr
- 1357 Coupler Ct
- 1236 Flora Glen Dr
- 2140 Burnside Dr
- 960 Cherry Tree Dr Unit 1
- 860 Cherry Tree Dr Unit 2
- 2007 Mesa Vista Dr
- 675 Parlanti Ln Unit 38
- 675 Parlanti Ln Unit 11
- 675 Parlanti Ln Unit 127
- 675 Parlanti Ln Unit 9
- 675 Parlanti Ln Unit 63
- 2363 William Morby Dr
- 2227 Valencia Way
- 2183 La Hacienda Dr
- 2507 Sycamore Glen Dr Unit 5
- 1254 Coachman Dr
- 1273 Express St
- 1250 Coachman Dr
- 1270 Express St
- 1275 Express St
- 1220 Express St
- 1274 Express St
- 1246 Coachman Dr
- 1274 Coachman Dr
- 1255 Ian St
- 1259 Skylark St
- 1253 Coachman Dr
- 1277 Express St
- 1257 Coachman Dr
- 1276 Express St
- 1245 Coachman Dr
- 1279 Express St
- 1251 Ian St
- 1242 Coachman Dr
Your Personal Tour Guide
Ask me questions while you tour the home.