12571 Forge Way Draper, UT 84020
Estimated Value: $684,000 - $758,000
2
Beds
4
Baths
1,526
Sq Ft
$473/Sq Ft
Est. Value
About This Home
This home is located at 12571 Forge Way, Draper, UT 84020 and is currently estimated at $721,623, approximately $472 per square foot. 12571 Forge Way is a home located in Salt Lake County with nearby schools including Draper Elementary School, Draper Park Middle School, and Corner Canyon High School.
Ownership History
Date
Name
Owned For
Owner Type
Purchase Details
Closed on
Apr 9, 2007
Sold by
The Ruth Silver Neilson Revocable Family and Neilson Ruth S
Bought by
Petersen Sharon and Petersen Patricia
Current Estimated Value
Purchase Details
Closed on
Aug 15, 2001
Sold by
Neilson Ruth S
Bought by
The Ruth Silver Neilson Revocable Family
Home Financials for this Owner
Home Financials are based on the most recent Mortgage that was taken out on this home.
Original Mortgage
$228,800
Interest Rate
6.25%
Purchase Details
Closed on
Aug 4, 1998
Sold by
Tolbert Connie
Bought by
Tolbert Connie J
Purchase Details
Closed on
Jun 30, 1997
Sold by
Village Communities L C
Bought by
Tolbert Connie
Home Financials for this Owner
Home Financials are based on the most recent Mortgage that was taken out on this home.
Original Mortgage
$150,000
Interest Rate
7.91%
Create a Home Valuation Report for This Property
The Home Valuation Report is an in-depth analysis detailing your home's value as well as a comparison with similar homes in the area
Home Values in the Area
Average Home Value in this Area
Purchase History
| Date | Buyer | Sale Price | Title Company |
|---|---|---|---|
| Petersen Sharon | -- | Equity Title | |
| The Ruth Silver Neilson Revocable Family | -- | Superior Title Company | |
| Neilson Ruth S | -- | Superior Title Company | |
| Tolbert Connie J | -- | -- | |
| Tolbert Connie | -- | -- |
Source: Public Records
Mortgage History
| Date | Status | Borrower | Loan Amount |
|---|---|---|---|
| Previous Owner | Neilson Ruth S | $228,800 | |
| Previous Owner | Tolbert Connie | $150,000 |
Source: Public Records
Tax History
| Year | Tax Paid | Tax Assessment Tax Assessment Total Assessment is a certain percentage of the fair market value that is determined by local assessors to be the total taxable value of land and additions on the property. | Land | Improvement |
|---|---|---|---|---|
| 2025 | $3,304 | $624,700 | $181,600 | $443,100 |
| 2024 | $3,304 | $631,200 | $169,700 | $461,500 |
| 2023 | $3,362 | $637,500 | $161,400 | $476,100 |
| 2022 | $3,434 | $629,000 | $158,200 | $470,800 |
| 2021 | $3,041 | $475,800 | $125,700 | $350,100 |
| 2020 | $2,912 | $431,900 | $125,700 | $306,200 |
| 2019 | $2,771 | $401,600 | $124,800 | $276,800 |
| 2016 | $2,523 | $347,900 | $89,700 | $258,200 |
Source: Public Records
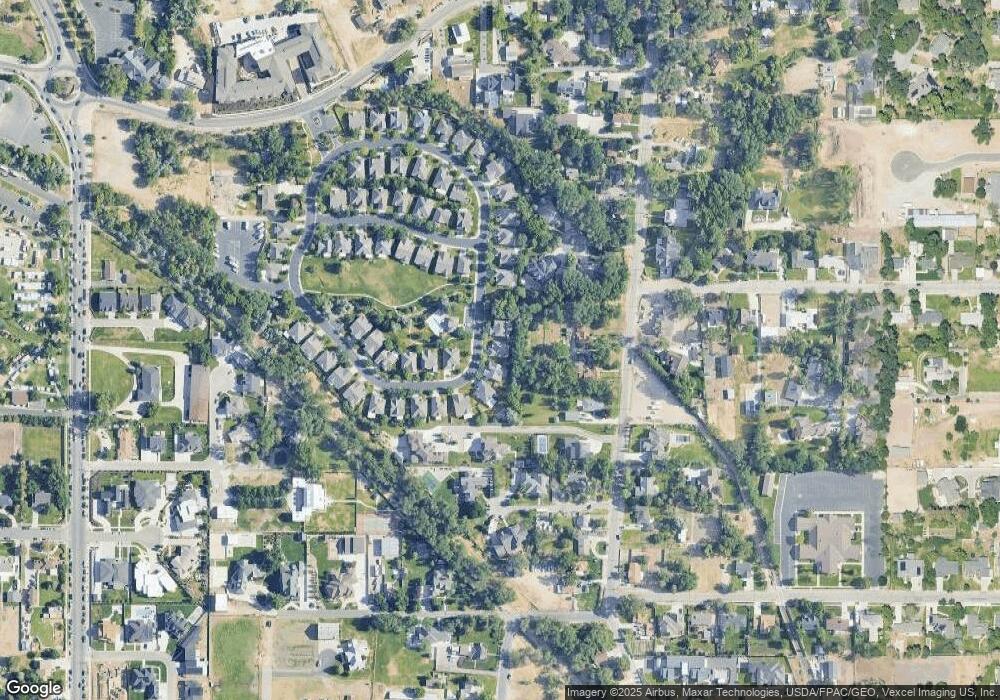
Map
Nearby Homes
- 12567 Blacksmith Ln
- 12397 S Relation St Unit 1
- 12525 S 1300 E
- 1285 Manfield Way
- 1187 E Parkstone Dr
- 1518 Stanford Ct
- 12182 S Pine Valley Way
- 13050 S 1300 E
- 12882 S Ellerbeck Ln Unit 12882
- 12838 Hickory Ridge Ln
- 12378 S Course View Ln
- 12268 S Raleigh Ct
- 12161 S Spring Ridge Cir
- 12298 S Graystone Ct
- 1139 Hidden Valley Dr
- 902 E 12650 S
- 2016 E Graystone Ct
- 12959 S Fort St
- 13216 S Telemark Ln
- 11855 S Hidden Valley Dr
- 12563 Forge Way
- 12583 Forge Way
- 1456 Blacksmith Ln
- 1449 Blacksmith Ln
- 1456 E Blacksmith Ln
- 12579 S Forge Way
- 1448 Blacksmith Ln
- 12566 S 1565 E
- 12544 S 1565 E
- 1439 Blacksmith Ln
- 12543 Forge Way
- 1442 Blacksmith Ln
- 1442 E Blacksmith Ln
- 1454 E Anvil Dr
- 1427 Blacksmith Ln
- 1494 E Quail Forest Cove
- 1454 Anvil Dr
- 1462 E Campbell View Cove
- 1434 E Blacksmith Ln
- 1434 Blacksmith Ln
Your Personal Tour Guide
Ask me questions while you tour the home.