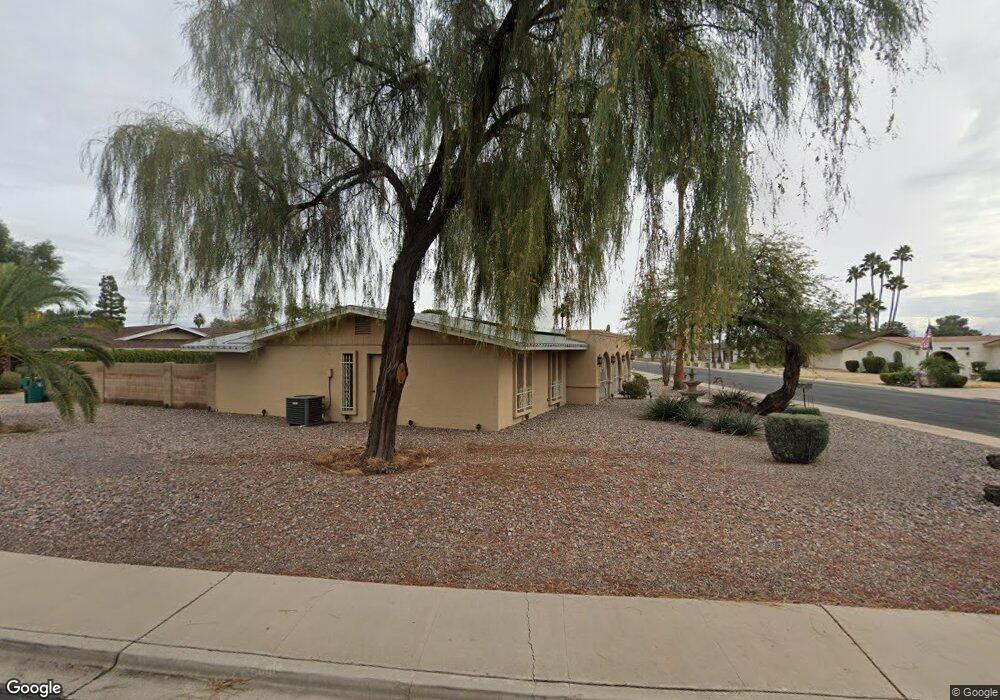
1258 E Encanto St Mesa, AZ 85203
North Central Mesa NeighborhoodEstimated Value: $603,000 - $617,492
4
Beds
2
Baths
2,560
Sq Ft
$238/Sq Ft
Est. Value
About This Home
This home is located at 1258 E Encanto St, Mesa, AZ 85203 and is currently estimated at $609,123, approximately $237 per square foot. 1258 E Encanto St is a home located in Maricopa County with nearby schools including Michael T. Hughes Elementary School, Franklin at Brimhall Elementary School, and Franklin West Elementary School.
Ownership History
Date
Name
Owned For
Owner Type
Purchase Details
Closed on
Jun 1, 2005
Sold by
Gerland Lisa
Bought by
Gerland Stephen
Current Estimated Value
Purchase Details
Closed on
Apr 22, 2003
Sold by
Guyan William and Guyan Linda J
Bought by
Gerland Stephen F and Gerland Lisa K
Home Financials for this Owner
Home Financials are based on the most recent Mortgage that was taken out on this home.
Original Mortgage
$145,000
Interest Rate
5.54%
Mortgage Type
New Conventional
Purchase Details
Closed on
Jul 9, 1997
Sold by
Reese Wilburn J and Reese Dolores I
Bought by
Guyan William and Guyan Linda J
Home Financials for this Owner
Home Financials are based on the most recent Mortgage that was taken out on this home.
Original Mortgage
$134,550
Interest Rate
7.62%
Mortgage Type
New Conventional
Purchase Details
Closed on
Feb 25, 1997
Sold by
Reese Wilburn J and Reese Dolores I
Bought by
Reese Wilburn J and Reese Dolores I
Create a Home Valuation Report for This Property
The Home Valuation Report is an in-depth analysis detailing your home's value as well as a comparison with similar homes in the area
Home Values in the Area
Average Home Value in this Area
Purchase History
| Date | Buyer | Sale Price | Title Company |
|---|---|---|---|
| Gerland Stephen | -- | -- | |
| Gerland Stephen F | $202,500 | Security Title Agency | |
| Guyan William | $149,500 | Ati Title Agency | |
| Reese Wilburn J | -- | -- |
Source: Public Records
Mortgage History
| Date | Status | Borrower | Loan Amount |
|---|---|---|---|
| Previous Owner | Gerland Stephen F | $145,000 | |
| Previous Owner | Guyan William | $134,550 |
Source: Public Records
Tax History
| Year | Tax Paid | Tax Assessment Tax Assessment Total Assessment is a certain percentage of the fair market value that is determined by local assessors to be the total taxable value of land and additions on the property. | Land | Improvement |
|---|---|---|---|---|
| 2025 | $2,329 | $28,046 | -- | -- |
| 2024 | $2,354 | $26,710 | -- | -- |
| 2023 | $2,354 | $44,030 | $8,800 | $35,230 |
| 2022 | $2,303 | $34,420 | $6,880 | $27,540 |
| 2021 | $2,366 | $32,100 | $6,420 | $25,680 |
| 2020 | $2,334 | $30,950 | $6,190 | $24,760 |
| 2019 | $1,815 | $25,720 | $5,140 | $20,580 |
| 2018 | $1,733 | $23,460 | $4,690 | $18,770 |
| 2017 | $1,678 | $22,610 | $4,520 | $18,090 |
| 2016 | $1,648 | $21,850 | $4,370 | $17,480 |
| 2015 | $1,556 | $19,370 | $3,870 | $15,500 |
Source: Public Records
Map
Nearby Homes
- 1105 N Delmar
- 1202 E Greenway Cir
- 1047 E Fairfield St
- 1524 E Fairbrook St
- 1204 E Glencove Cir
- 1036 E Fairfield St
- 1030 E Fairfield St
- 1260 E Downing St
- 1232 E Granada St
- 959 E Fairfield St
- 1549 E Greenway St
- 1365 N Diane Cir
- 962 E 8th Place
- 1625 E Greenway St
- 1304 E Hackamore St
- 902 E 10th Place
- 1116 E Hackamore St
- 860 E Brown Rd Unit 29
- 853 E Fairfield St
- 823 N Hill Cir
- 1261 E Fairfield St
- 1017 E Assisted Living Cir
- 1257 E Encanto St
- 1304 E Encanto St
- 1251 E Encanto St
- 1039 N Diane St
- 1309 E Fairfield St
- 1314 E Encanto St
- 1258 E Fairfield St
- 1265 E Encanto St
- 1030 N Diane St
- 1300 E Fairfield St
- 1049 N Diane St
- 1317 E Fairfield St
- 1036 N Diane St
- 1308 E Fairfield St
- 1316 E Encanto St
- 1257 E Fountain St
- 1265 E Fountain St
- 1046 N Diane St
Your Personal Tour Guide
Ask me questions while you tour the home.