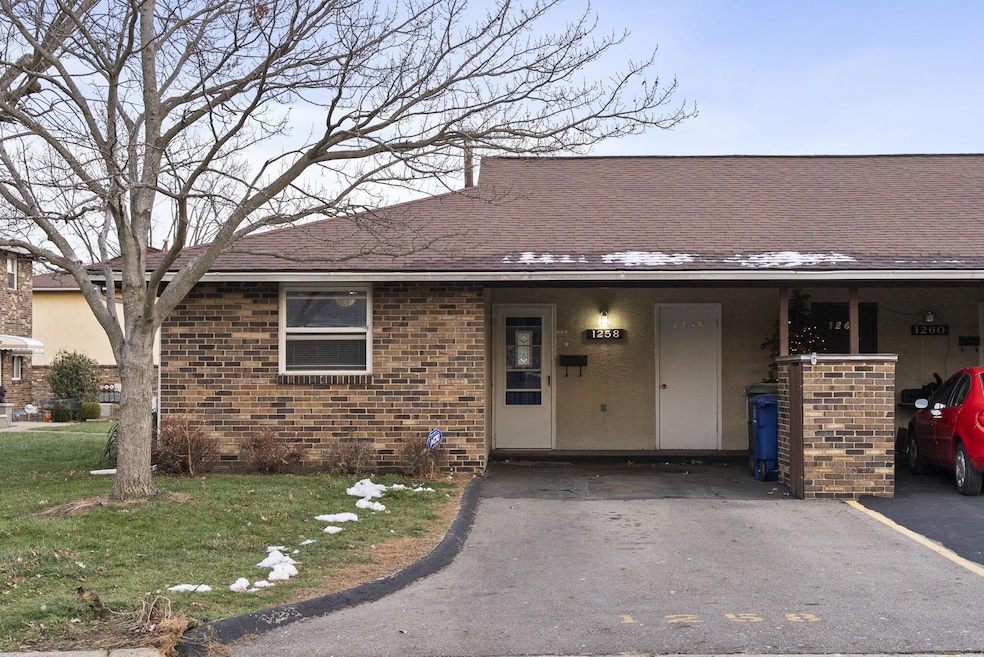
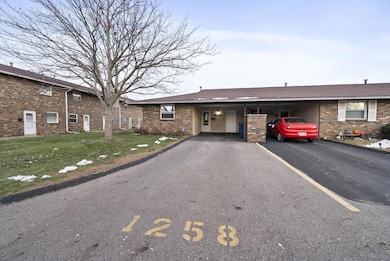
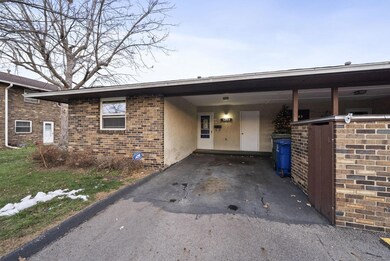
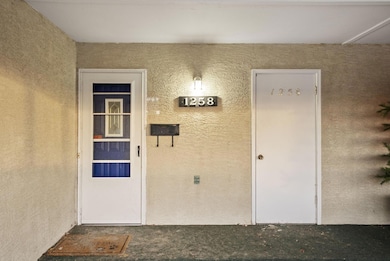
1258 Woodbrook Cir W Unit 199 Columbus, OH 43223
Brookshire NeighborhoodEstimated payment $806/month
Highlights
- In Ground Pool
- Main Floor Primary Bedroom
- Patio
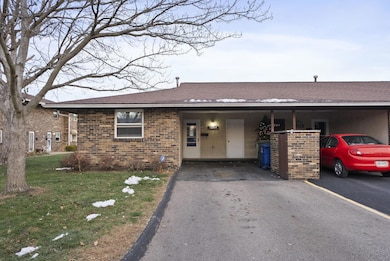
- Ranch Style House
- Fenced Yard
- Central Air
About This Home
Step into this beautifully updated one-bedroom ranch condo, perfectly designed for comfort, style, and easy living. Nearly every inch has been refreshed with modern finishes and thoughtful upgrades.
Inside, you'll find brand-new quartz countertops, new cabinets, a large sink with garbage disposal, and added space for a dishwasher—all complemented by new appliances including a refrigerator, dishwasher, overhead microwave, and a washer/dryer combo for ultimate convenience. A charming breakfast nook adds the perfect spot for morning coffee or casual meals.
The bathroom has been completely transformed with a new full-size double stand-up shower surround, new vanity and sink, new toilet, and new interior doors on both the bathroom and bedroom.
Additional updates include new vinyl flooring throughout, new tile in the entry, and major mechanical peace of mind with a new furnace and AC.
This move-in-ready condo offers modern living in a low-maintenance layout—ideal for a first-time buyer, downsizer, or anyone seeking a stylish and efficient space to call home.
Listing Agent
Howard Hanna Real Estate Svcs License #2013002619 Listed on: 12/11/2025

Property Details
Home Type
- Condominium
Est. Annual Taxes
- $998
Year Built
- Built in 1967
Lot Details
- 1 Common Wall
- Fenced Yard
HOA Fees
- $170 Monthly HOA Fees
Home Design
- Ranch Style House
- Slab Foundation
Interior Spaces
- 718 Sq Ft Home
- Insulated Windows
- Vinyl Flooring
- Electric Dryer Hookup
Kitchen
- Microwave
- Dishwasher
Bedrooms and Bathrooms
- 1 Primary Bedroom on Main
- 1 Full Bathroom
Parking
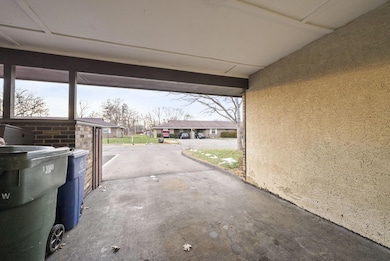
- 1 Carport Space
- No Garage
- Off-Street Parking: 2
Outdoor Features
- In Ground Pool
- Patio
Utilities
- Central Air
- Heating System Uses Gas
- Hot Water Heating System
Listing and Financial Details
- Assessor Parcel Number 010-161165
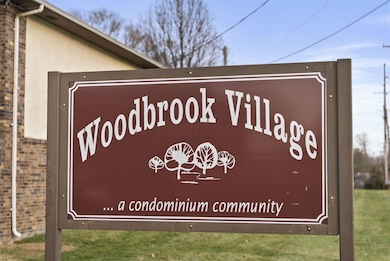
Community Details
Overview
- Association fees include lawn care, trash, water
- Association Phone (614) 717-3054
- Angie HOA
- On-Site Maintenance
Recreation
- Community Pool
Map
Home Values in the Area
Average Home Value in this Area
Tax History
| Year | Tax Paid | Tax Assessment Tax Assessment Total Assessment is a certain percentage of the fair market value that is determined by local assessors to be the total taxable value of land and additions on the property. | Land | Improvement |
|---|---|---|---|---|
| 2024 | $1,508 | $21,770 | $5,250 | $16,520 |
| 2023 | $985 | $21,770 | $5,250 | $16,520 |
| 2022 | $534 | $10,050 | $1,540 | $8,510 |
| 2021 | $535 | $10,050 | $1,540 | $8,510 |
| 2020 | $536 | $10,050 | $1,540 | $8,510 |
| 2019 | $499 | $8,020 | $1,230 | $6,790 |
| 2018 | $480 | $8,020 | $1,230 | $6,790 |
| 2017 | $499 | $8,020 | $1,230 | $6,790 |
| 2016 | $507 | $7,460 | $1,580 | $5,880 |
| 2015 | $461 | $7,460 | $1,580 | $5,880 |
| 2014 | $463 | $7,460 | $1,580 | $5,880 |
| 2013 | -- | $8,295 | $1,750 | $6,545 |
Purchase History
| Date | Type | Sale Price | Title Company |
|---|---|---|---|
| Warranty Deed | $47,300 | Cardinal Title | |
| Warranty Deed | $25,000 | Commerce Park Title Agency | |
| Warranty Deed | $37,000 | Independent Title | |
| Deed | $25,000 | -- | |
| Deed | -- | -- |
Mortgage History
| Date | Status | Loan Amount | Loan Type |
|---|---|---|---|
| Previous Owner | $29,600 | Purchase Money Mortgage |
Source: Columbus and Central Ohio Regional MLS
MLS Number: 225045371
APN: 010-161165
Disclaimer: Certain information contained herein is derived from information provided by parties other than Homes.com. All information provided is deemed reliable, but is not guaranteed to be accurate and should be independently verified.
![]() IDX information is provided exclusively for personal, non-commercial use, and may not be used for any purpose other than to identify prospective properties consumers may be interested in purchasing.
IDX information is provided exclusively for personal, non-commercial use, and may not be used for any purpose other than to identify prospective properties consumers may be interested in purchasing.
Information is deemed reliable but not guaranteed.
- 2362 Woodbrook Cir N Unit 81
- 2336 Woodbrook Cir N Unit 92 B
- 1119 Hardesty Place E Unit 1
- 2382 Hardesty Dr S Unit Q-5
- 1085 Hardesty Place E Unit 4
- 2436 Hardesty Dr S Unit 4
- 2337 Hardesty Ct Unit 1
- 0 S Central Ave
- 2547 Rosedale Ave
- 2334 Hardesty Ct Unit 5
- 2367 Hardesty Dr N Unit 1-1
- 2210 October Ridge Dr
- 2180 Eakin Rd
- 1543 Red Leaf Ln
- 2610 Spaatz Ave
- 2491 Vanderberg Ave
- 1607 Red Leaf Ln
- 2530 Vanderberg Ave
- 2538 Vanderberg Ave
- 1994 Little Ave
- 2350 Appleridge Dr
- 947 Forest Creek Dr E
- 2911 N Gresham Rd
- 1904 Little Water Dr
- 671-673-673 S Wheatland Ave Unit 671 S Wheatland
- 949 S Harris Ave
- 821 S Harris Ave
- 2171 Amherst Ave
- 1644 Eastbrook Dr S
- 1927 Vaughn St
- 534 S Richardson Ave
- 2275 Union Ave
- 478 S Richardson Ave Unit 2
- 432 S Highland Ave
- 1475 Stimmel Rd
- 2895 Sullivant Ave
- 367 S Wayne Ave
- 2097 Earlsway Dr
- 2520 Blue Rock Blvd
- 610 Salisbury Rd