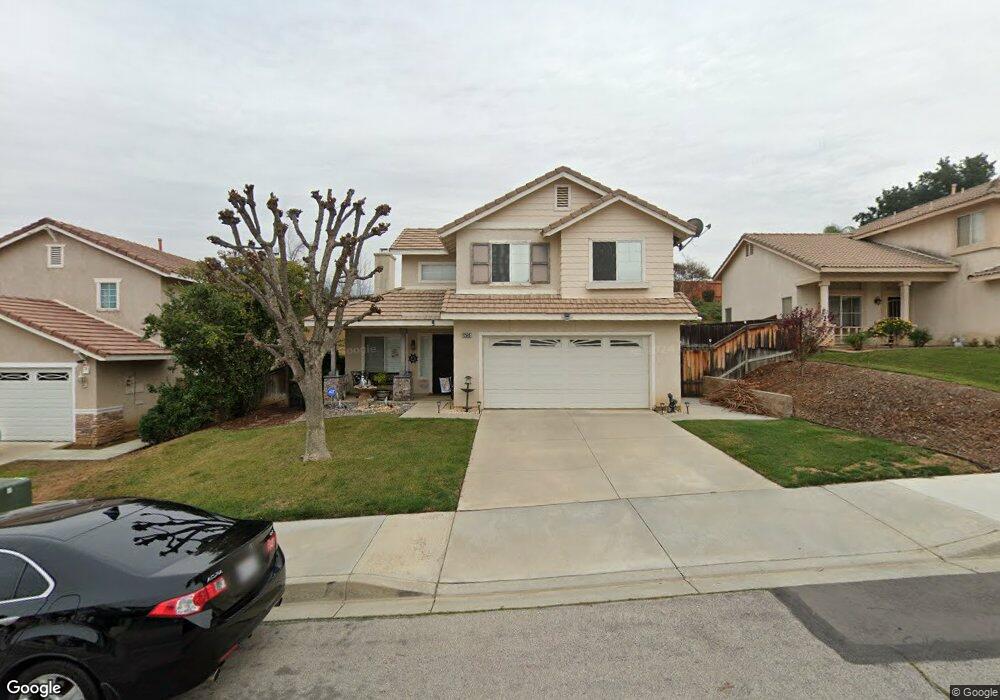
12585 Redstone Cir Yucaipa, CA 92399
Estimated Value: $531,589 - $587,000
3
Beds
3
Baths
1,569
Sq Ft
$363/Sq Ft
Est. Value
About This Home
This home is located at 12585 Redstone Cir, Yucaipa, CA 92399 and is currently estimated at $568,897, approximately $362 per square foot. 12585 Redstone Cir is a home located in San Bernardino County with nearby schools including Valley Elementary School, Mesa View Middle School, and Yucaipa High School.
Ownership History
Date
Name
Owned For
Owner Type
Purchase Details
Closed on
Oct 10, 2002
Sold by
Salvador Joseph M and Salvador Christine M
Bought by
Salvador Joseph M and Salvador Christine M
Current Estimated Value
Home Financials for this Owner
Home Financials are based on the most recent Mortgage that was taken out on this home.
Original Mortgage
$131,000
Interest Rate
6.05%
Purchase Details
Closed on
Dec 15, 1998
Sold by
Leonard Bradley D and Leonard Robert D
Bought by
Salvador Joseph M and Saiz Christine M
Home Financials for this Owner
Home Financials are based on the most recent Mortgage that was taken out on this home.
Original Mortgage
$135,751
Interest Rate
6.82%
Purchase Details
Closed on
Jan 3, 1996
Sold by
Centex Real Estate Corp
Bought by
Leonard Bradley D and Leonard Robert D
Home Financials for this Owner
Home Financials are based on the most recent Mortgage that was taken out on this home.
Original Mortgage
$127,294
Interest Rate
7.18%
Mortgage Type
FHA
Create a Home Valuation Report for This Property
The Home Valuation Report is an in-depth analysis detailing your home's value as well as a comparison with similar homes in the area
Home Values in the Area
Average Home Value in this Area
Purchase History
| Date | Buyer | Sale Price | Title Company |
|---|---|---|---|
| Salvador Joseph M | -- | American Title | |
| Salvador Joseph M | $140,000 | Commonwealth Land Title Co | |
| Leonard Bradley D | $131,000 | Stewart Title |
Source: Public Records
Mortgage History
| Date | Status | Borrower | Loan Amount |
|---|---|---|---|
| Closed | Salvador Joseph M | $131,000 | |
| Closed | Salvador Joseph M | $135,751 | |
| Previous Owner | Leonard Bradley D | $127,294 |
Source: Public Records
Tax History Compared to Growth
Tax History
| Year | Tax Paid | Tax Assessment Tax Assessment Total Assessment is a certain percentage of the fair market value that is determined by local assessors to be the total taxable value of land and additions on the property. | Land | Improvement |
|---|---|---|---|---|
| 2025 | $2,935 | $219,090 | $54,714 | $164,376 |
| 2024 | $2,935 | $214,794 | $53,641 | $161,153 |
| 2023 | $2,854 | $210,582 | $52,589 | $157,993 |
| 2022 | $2,754 | $206,453 | $51,558 | $154,895 |
| 2021 | $2,480 | $202,405 | $50,547 | $151,858 |
| 2020 | $2,978 | $200,330 | $50,029 | $150,301 |
| 2019 | $2,912 | $196,402 | $49,048 | $147,354 |
| 2018 | $2,624 | $192,551 | $48,086 | $144,465 |
| 2017 | $2,546 | $188,775 | $47,143 | $141,632 |
| 2016 | $2,518 | $185,074 | $46,219 | $138,855 |
| 2015 | $2,575 | $182,294 | $45,525 | $136,769 |
| 2014 | $2,540 | $178,723 | $44,633 | $134,090 |
Source: Public Records
Map
Nearby Homes
- 12510 8th St
- 12422 Stardell Ln
- 33540 Washington Dr
- 33504 Liberty Rd
- 36551 Avenue E
- 12813 7th St Unit 26
- 12813 7th St#65 St Unit 65
- 12448 6th St
- 12798 6th St
- 12830 6th St Unit 43
- 12830 6th St Unit 2
- 12830 6th St Unit 15
- 92399 Yucaipa Blvd
- 33142 Lotus Ave
- 34075 Lily Rd Unit 37
- 34083 Lily Rd Unit 33
- 34225 Via Buena Dr
- 33353 Wallace Way
- 33600 Calimesa Blvd Unit 37
- 12220 5th St Unit 193
- 12575 Redstone Cir
- 12595 Redstone Cir
- 12565 Redstone Cir
- 12605 Redstone Cir
- 33672 Avenue E
- 12580 Redstone Cir
- 12590 Redstone Cir
- 12555 Redstone Cir
- 12615 Redstone Cir
- 12570 Redstone Cir
- 33630 Brushy Hollow Dr
- 12574 8th St
- 12590 8th St
- 12625 Redstone Cir
- 12560 Redstone Cir
- 12545 Redstone Cir
- 12558 8th St
- 33620 Brushy Hollow Dr
- 33599 Terrie Way
- 33596 Terrie Way