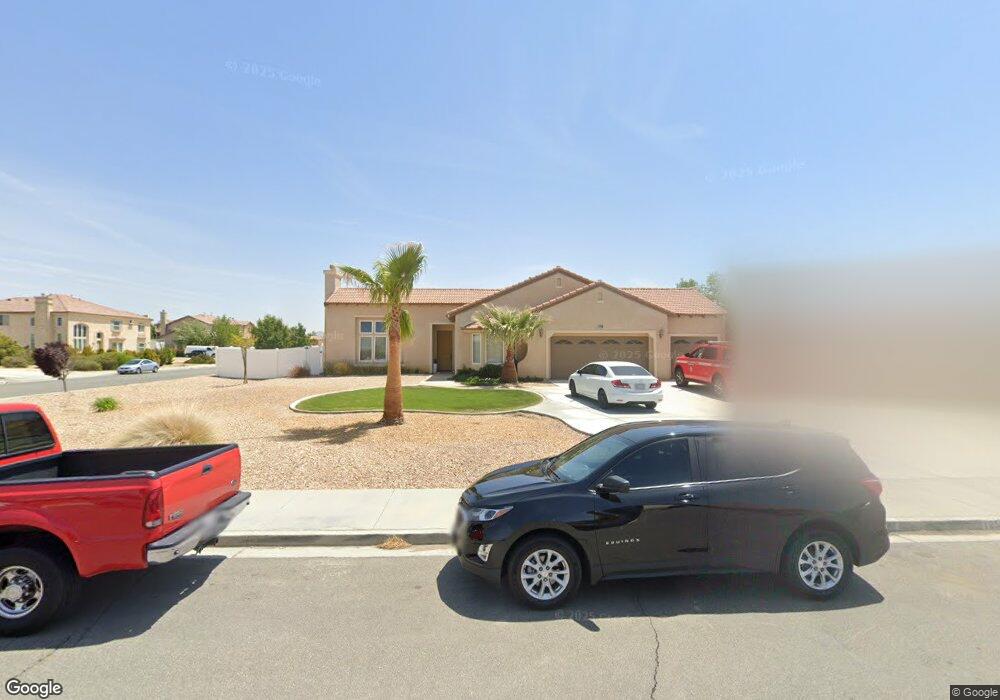
12589 Cabazon Ct Apple Valley, CA 92308
High Desert NeighborhoodEstimated Value: $644,000 - $764,000
4
Beds
3
Baths
3,202
Sq Ft
$219/Sq Ft
Est. Value
About This Home
This home is located at 12589 Cabazon Ct, Apple Valley, CA 92308 and is currently estimated at $702,424, approximately $219 per square foot. 12589 Cabazon Ct is a home located in San Bernardino County with nearby schools including Rio Vista School of Applied Learning, Apple Valley High School, and Excelsior Charter School.
Ownership History
Date
Name
Owned For
Owner Type
Purchase Details
Closed on
Jun 13, 2024
Sold by
Solis Sean M and Solis Juli E
Bought by
Solis Family Trust and Solis
Current Estimated Value
Purchase Details
Closed on
Apr 6, 2009
Sold by
Lin Ching Chih
Bought by
Solis Sean M and Solis Juli E
Home Financials for this Owner
Home Financials are based on the most recent Mortgage that was taken out on this home.
Original Mortgage
$319,113
Interest Rate
4.82%
Mortgage Type
FHA
Purchase Details
Closed on
Jun 17, 2008
Sold by
Lin Ming Hsiang
Bought by
Lin Ching Chih
Purchase Details
Closed on
May 19, 2008
Sold by
Chiu Yen Homer Shih Hung and Chiu Yen Juanita
Bought by
Lin Ching Chih
Purchase Details
Closed on
Sep 14, 2007
Sold by
First Pacific Homes Ii Llc
Bought by
First Pacific Homes Llc
Create a Home Valuation Report for This Property
The Home Valuation Report is an in-depth analysis detailing your home's value as well as a comparison with similar homes in the area
Home Values in the Area
Average Home Value in this Area
Purchase History
| Date | Buyer | Sale Price | Title Company |
|---|---|---|---|
| Solis Family Trust | -- | None Listed On Document | |
| Solis Sean M | $325,000 | First American Title Company | |
| Lin Ching Chih | -- | First American Title Ins Co | |
| Lin Ching Chih | $370,000 | First American Title Ins Co | |
| First Pacific Homes Llc | -- | Accommodation |
Source: Public Records
Mortgage History
| Date | Status | Borrower | Loan Amount |
|---|---|---|---|
| Previous Owner | Solis Sean M | $319,113 |
Source: Public Records
Tax History
| Year | Tax Paid | Tax Assessment Tax Assessment Total Assessment is a certain percentage of the fair market value that is determined by local assessors to be the total taxable value of land and additions on the property. | Land | Improvement |
|---|---|---|---|---|
| 2025 | $5,443 | $438,938 | $125,557 | $313,381 |
| 2024 | $5,272 | $430,331 | $123,095 | $307,236 |
| 2023 | $5,227 | $421,893 | $120,681 | $301,212 |
| 2022 | $5,153 | $413,621 | $118,315 | $295,306 |
| 2021 | $5,042 | $405,511 | $115,995 | $289,516 |
| 2020 | $4,985 | $401,353 | $114,806 | $286,547 |
| 2019 | $4,898 | $393,483 | $112,555 | $280,928 |
| 2018 | $4,753 | $382,827 | $110,348 | $272,479 |
| 2017 | $4,529 | $360,613 | $108,183 | $252,430 |
| 2016 | $4,399 | $353,542 | $106,062 | $247,480 |
| 2015 | $4,339 | $348,232 | $104,469 | $243,763 |
| 2014 | $4,285 | $341,411 | $102,423 | $238,988 |
Source: Public Records
Map
Nearby Homes
- 12635 Sorrel Dr
- 12690 Mar Vista Dr
- 12720 Yorkshire Dr
- 18965 Shetland Rd
- 12925 Davona Dale Rd
- 19265 Kanbridge St
- 19274 Kanbridge St
- 12971 Lompoc Rd
- 18663 Arrowhead Trail
- 13195 Trailwood Way
- 19262 Monterey St
- 13005 Riverview Dr
- 13089 Bermuda Dunes Rd
- 0 Westmont Dr
- 12685 Pinehurst
- 13250 Ivanpah Rd
- 13262 Cuyamaca Rd
- 12850 Bermuda Dunes Dr
- 18505 Kalin Ranch Dr
- 13114 Choco Rd
- 19196 Saguaro Way
- 12588 Yorkshire Dr
- 12557 Cabazon Ct
- 19165 Saguaro Way
- 19216 Saguaro Way
- 12572 Yorkshire Dr
- 19176 Saguaro Way
- 12556 Yorkshire Dr
- 19236 Saguaro Way
- 12541 Cabazon Ct
- 19149 Saguaro Way
- 19156 Saguaro Way
- 19183 La Quinta Place Unit 1
- 19183 La Quinta Place
- 12540 Yorkshire Dr
- 12600 Apple Valley Rd
- 12640 Yorkshire Dr
- 19199 La Quinta Place
- 19167 La Quinta Place
- 19133 Saguaro Way
Your Personal Tour Guide
Ask me questions while you tour the home.