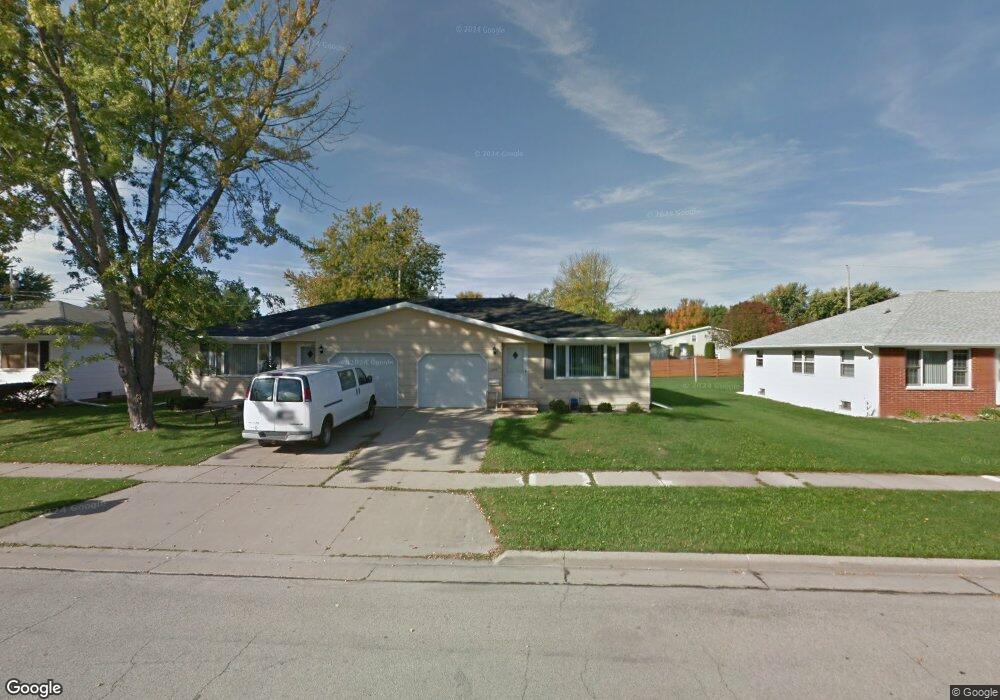
1259 Meadow Ln Unit 1261 Neenah, WI 54956
Estimated Value: $223,682 - $262,000
3
Beds
2
Baths
1,020
Sq Ft
$236/Sq Ft
Est. Value
About This Home
This home is located at 1259 Meadow Ln Unit 1261, Neenah, WI 54956 and is currently estimated at $241,171, approximately $236 per square foot. 1259 Meadow Ln Unit 1261 is a home located in Winnebago County with nearby schools including Tullar Elementary School, Horace Mann Middle School, and Neenah Middle School.
Ownership History
Date
Name
Owned For
Owner Type
Purchase Details
Closed on
Jul 12, 2021
Sold by
Pelky Shalaun P and Cartwright Shalaun P
Bought by
Pelky Phillip and Pelky Shalaun P
Current Estimated Value
Purchase Details
Closed on
Aug 24, 2013
Sold by
Beese Richard J and Beese J R
Bought by
Cartwright Shalaun P
Home Financials for this Owner
Home Financials are based on the most recent Mortgage that was taken out on this home.
Original Mortgage
$88,500
Outstanding Balance
$63,380
Interest Rate
3.49%
Mortgage Type
Adjustable Rate Mortgage/ARM
Estimated Equity
$177,791
Purchase Details
Closed on
Feb 3, 2010
Sold by
Protz Peter J and Protz Connie C
Bought by
Beese Richard J
Create a Home Valuation Report for This Property
The Home Valuation Report is an in-depth analysis detailing your home's value as well as a comparison with similar homes in the area
Home Values in the Area
Average Home Value in this Area
Purchase History
| Date | Buyer | Sale Price | Title Company |
|---|---|---|---|
| Pelky Phillip | -- | None Available | |
| Cartwright Shalaun P | $28,800 | None Available | |
| Beese Richard J | $112,500 | -- |
Source: Public Records
Mortgage History
| Date | Status | Borrower | Loan Amount |
|---|---|---|---|
| Open | Cartwright Shalaun P | $88,500 |
Source: Public Records
Tax History Compared to Growth
Tax History
| Year | Tax Paid | Tax Assessment Tax Assessment Total Assessment is a certain percentage of the fair market value that is determined by local assessors to be the total taxable value of land and additions on the property. | Land | Improvement |
|---|---|---|---|---|
| 2024 | $3,269 | $187,000 | $30,600 | $156,400 |
| 2023 | $2,584 | $98,600 | $18,000 | $80,600 |
| 2022 | $2,594 | $138,000 | $29,000 | $109,000 |
| 2021 | $2,336 | $138,000 | $29,000 | $109,000 |
| 2020 | $2,932 | $138,000 | $29,000 | $109,000 |
| 2019 | $2,249 | $138,000 | $29,000 | $109,000 |
| 2018 | $2,186 | $116,500 | $27,900 | $88,600 |
| 2017 | $2,253 | $116,500 | $27,900 | $88,600 |
| 2016 | $2,785 | $116,500 | $27,900 | $88,600 |
| 2015 | $2,756 | $115,000 | $18,000 | $97,000 |
| 2014 | $2,769 | $115,000 | $18,000 | $97,000 |
| 2013 | $2,780 | $115,000 | $18,000 | $97,000 |
Source: Public Records
Map
Nearby Homes
- 1201 Green Acres Ln
- 1133 Primrose Ct Unit 1135
- 1112 Oxford Ct
- 929 Gay Dr Unit 931
- 1316 Wedgewood Ln
- 1241 Cameron Cir
- 1372 Baytree Ln
- 1228 Cameron Cir Unit 82
- 1341 Alpine Ln
- 1442 Baytree Ln
- 1016 Gregory St
- 970 Manor Dr Unit 72
- 970 Manor Dr Unit 74
- 1160 Westwind Dr
- 1500 Hidden Acres Ln
- 668 Dartmouth Dr
- 8404 Clayton Ave
- 985 Babcock St
- 1160 Brittany Ct Unit 94
- 940 Babcock St Unit 96
- 1255 Meadow Ln Unit 1257
- 1263 Meadow Ln Unit 1265
- 1248 Meadow Ln Unit 1250
- 1254 Honeysuckle Ln
- 1260 Honeysuckle Ln
- 1245 Meadow Ln Unit 1247
- 1273 Meadow Ln Unit 1275
- 1248 Honeysuckle Ln
- 1272 Meadow Ln Unit 1274
- 1254 Meadow Ln Unit 1256
- 1266 Honeysuckle Ln
- 1242 Honeysuckle Ln
- 1242 Meadow Ln Unit 1244
- 1279 Meadow Ln Unit 1281
- 1279 Meadow Ln Unit Meadow Lane
- 1272 Honeysuckle Ln
- 1258 Meadow Ln Unit 1260
- 1237 Meadow Ln Unit 1239
- 1249 Primrose Ln Unit 1251
- 1255 Primrose Ln Unit 1257