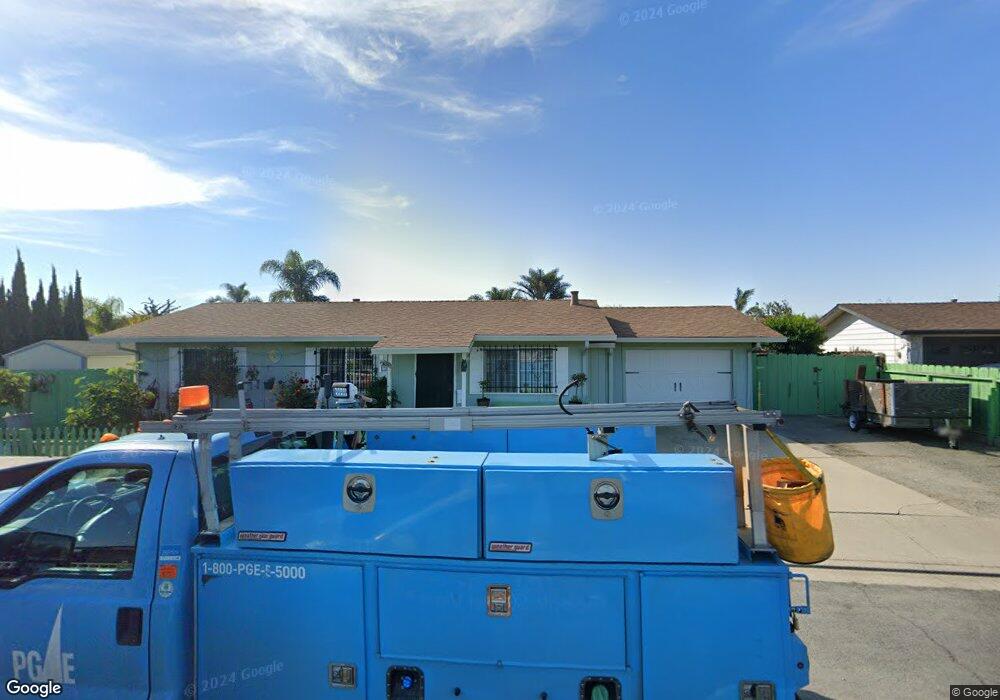
1259 Nogal Dr Salinas, CA 93905
East Salinas NeighborhoodEstimated Value: $534,000 - $643,000
3
Beds
1
Bath
960
Sq Ft
$587/Sq Ft
Est. Value
About This Home
This home is located at 1259 Nogal Dr, Salinas, CA 93905 and is currently estimated at $563,288, approximately $586 per square foot. 1259 Nogal Dr is a home located in Monterey County with nearby schools including Virginia Rocca Barton Elementary School, La Paz Middle School, and Alisal High School.
Ownership History
Date
Name
Owned For
Owner Type
Purchase Details
Closed on
May 27, 2005
Sold by
Kramm Amalia E
Bought by
Mercado Amalia E
Current Estimated Value
Home Financials for this Owner
Home Financials are based on the most recent Mortgage that was taken out on this home.
Original Mortgage
$273,000
Outstanding Balance
$142,339
Interest Rate
5.74%
Mortgage Type
Fannie Mae Freddie Mac
Estimated Equity
$420,949
Purchase Details
Closed on
May 26, 2005
Sold by
Mercado Amalia E
Bought by
Mercado Teodoro B and Mercado Amalia E
Home Financials for this Owner
Home Financials are based on the most recent Mortgage that was taken out on this home.
Original Mortgage
$273,000
Outstanding Balance
$142,339
Interest Rate
5.74%
Mortgage Type
Fannie Mae Freddie Mac
Estimated Equity
$420,949
Purchase Details
Closed on
Mar 20, 1998
Sold by
Locatelli Joe and Husted Becky Sue
Bought by
Kramm Amalia E
Home Financials for this Owner
Home Financials are based on the most recent Mortgage that was taken out on this home.
Original Mortgage
$126,329
Interest Rate
7%
Mortgage Type
FHA
Create a Home Valuation Report for This Property
The Home Valuation Report is an in-depth analysis detailing your home's value as well as a comparison with similar homes in the area
Home Values in the Area
Average Home Value in this Area
Purchase History
| Date | Buyer | Sale Price | Title Company |
|---|---|---|---|
| Mercado Amalia E | $273,000 | First American Title | |
| Mercado Amalia E | -- | First American Title | |
| Mercado Teodoro B | -- | -- | |
| Kramm Amalia E | $127,500 | Chicago Title Co |
Source: Public Records
Mortgage History
| Date | Status | Borrower | Loan Amount |
|---|---|---|---|
| Open | Mercado Amalia E | $273,000 | |
| Previous Owner | Kramm Amalia E | $126,329 |
Source: Public Records
Tax History
| Year | Tax Paid | Tax Assessment Tax Assessment Total Assessment is a certain percentage of the fair market value that is determined by local assessors to be the total taxable value of land and additions on the property. | Land | Improvement |
|---|---|---|---|---|
| 2025 | $2,607 | $203,567 | $103,780 | $99,787 |
| 2024 | $2,607 | $199,577 | $101,746 | $97,831 |
| 2023 | $2,558 | $195,664 | $99,751 | $95,913 |
| 2022 | $2,301 | $191,829 | $97,796 | $94,033 |
| 2021 | $2,300 | $188,069 | $95,879 | $92,190 |
| 2020 | $2,274 | $186,141 | $94,896 | $91,245 |
| 2019 | $2,343 | $182,492 | $93,036 | $89,456 |
| 2018 | $2,206 | $178,914 | $91,212 | $87,702 |
| 2017 | $2,288 | $175,407 | $89,424 | $85,983 |
| 2016 | $2,169 | $171,969 | $87,671 | $84,298 |
| 2015 | $2,149 | $169,387 | $86,355 | $83,032 |
| 2014 | $2,071 | $166,070 | $84,664 | $81,406 |
Source: Public Records
Map
Nearby Homes
- 11 Fresa Place
- 755 Pino Way
- 1099 Twin Creeks Dr
- 1126 Pacific Ave
- 948 Rider Ave
- 18 Hancock Cir
- 1046 C St
- 1725 Great Island St
- 1544 Saguaro Dr Unit 4
- 10 Rex Cir
- 933 Acosta Plaza Unit 35
- 15 Cheswick Cir
- 11 E Laurel Dr
- 1849 Bradbury St
- 1671 Cambrian Dr
- 11 Hill Cir
- 1914 Whitman St
- 609 Saint George Dr
- 1918 Bradbury St
- 1527 Atherton Way
- 1249 Nogal Dr
- 1295 Nogal Dr Unit B
- 1295 Nogal Dr Unit C
- 695 Las Casitas Dr Unit 38
- 1295 Nogal Dr Unit A
- 1269 Nogal Dr Unit 2
- 1269 Nogal Dr Unit A
- 1291 Nogal Dr Unit A
- 1287 Nogal Dr Unit B
- 1291 Nogal Dr Unit D
- 1291 Nogal Dr Unit C
- 1291 Nogal Dr Unit B
- 1287 Nogal Dr Unit D
- 1287 Nogal Dr Unit C
- 1287 Nogal Dr Unit A
- 1269 Nogal Dr Unit D
- 1269 Nogal Dr Unit C
- 711 Las Casitas Dr
- 691 Las Casitas Dr
- 695 Las Casitas Dr
Your Personal Tour Guide
Ask me questions while you tour the home.