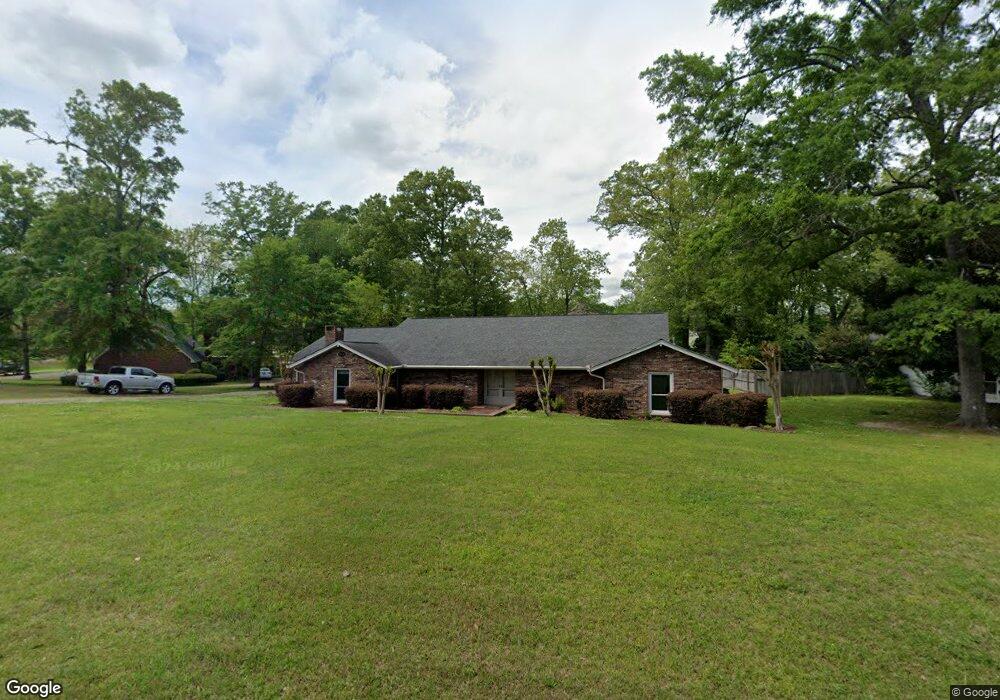
1259 Pecan Ln West Point, MS 39773
Estimated Value: $294,000 - $364,000
3
Beds
3
Baths
2,171
Sq Ft
$151/Sq Ft
Est. Value
About This Home
This home is located at 1259 Pecan Ln, West Point, MS 39773 and is currently estimated at $328,668, approximately $151 per square foot. 1259 Pecan Ln is a home located in Clay County with nearby schools including East Side Elementary School, West Clay Elementary School, and Church Hill Elementary School.
Ownership History
Date
Name
Owned For
Owner Type
Purchase Details
Closed on
Aug 29, 2011
Sold by
Donovan Secretary Of Housing And U Shaun
Bought by
Carpenter Paul Stephen and Carpenter Lucas Paul
Current Estimated Value
Home Financials for this Owner
Home Financials are based on the most recent Mortgage that was taken out on this home.
Original Mortgage
$82,710
Outstanding Balance
$57,418
Interest Rate
4.55%
Estimated Equity
$271,250
Purchase Details
Closed on
May 3, 2011
Sold by
Wells Fargo Bank Na
Bought by
Secretary Of Housing And Urban Developme
Create a Home Valuation Report for This Property
The Home Valuation Report is an in-depth analysis detailing your home's value as well as a comparison with similar homes in the area
Home Values in the Area
Average Home Value in this Area
Purchase History
| Date | Buyer | Sale Price | Title Company |
|---|---|---|---|
| Carpenter Paul Stephen | -- | -- | |
| Secretary Of Housing And Urban Developme | -- | -- |
Source: Public Records
Mortgage History
| Date | Status | Borrower | Loan Amount |
|---|---|---|---|
| Open | Secretary Of Housing And Urban Developme | $82,710 | |
| Previous Owner | Secretary Of Housing And Urban Developme | $148,555 |
Source: Public Records
Tax History Compared to Growth
Tax History
| Year | Tax Paid | Tax Assessment Tax Assessment Total Assessment is a certain percentage of the fair market value that is determined by local assessors to be the total taxable value of land and additions on the property. | Land | Improvement |
|---|---|---|---|---|
| 2024 | $918 | $24,423 | $2,875 | $21,548 |
| 2023 | $2,533 | $24,423 | $2,875 | $21,548 |
| 2022 | $922 | $24,423 | $2,875 | $21,548 |
| 2021 | $920 | $24,423 | $2,875 | $21,548 |
| 2020 | $920 | $24,423 | $2,875 | $21,548 |
| 2019 | $875 | $24,423 | $2,875 | $21,548 |
| 2018 | $838 | $24,423 | $2,875 | $21,548 |
| 2017 | $838 | $24,423 | $2,875 | $21,548 |
| 2016 | $1,095 | $22,991 | $4,313 | $18,678 |
| 2015 | $546 | $13,943 | $2,875 | $11,068 |
| 2014 | $449 | $13,943 | $2,875 | $11,068 |
| 2013 | $449 | $13,943 | $2,875 | $11,068 |
Source: Public Records
Map
Nearby Homes
- 219 Mapleview Rd
- 161 Mapleview Rd
- 389 Mapleview Rd
- 15 David St
- 44 Torbert Dr
- 1046 E Brame Ave
- 472 S Eshman Ave
- 3986 E Church Hill Rd
- 329 Converse Dr
- 278 Converse Dr
- 164 Belvedere Ave
- 0 Old Tibbee Rd
- 402 Cromwell St
- 238 Calhoun St
- 346 E Brame Ave
- 551 E Westbrook St
- 480 E Westbrook St
- 479 E Westbrook St
- 485 E Westbrook St
- 1180 E Broad St
- 1247 Pecan Ln
- 1323 Pecan Ln
- 1244 S Eshman Ave
- 1308 Sycamore Dr
- 1254 Pecan Ln
- 1246 Pecan Ln
- 1231 Pecan Ln
- 1321 Pecan Ln
- 1360 S Eshman Ave
- 1309 Walnut Rd
- 150 Pecan Ln
- 1314 Elm Crest Cove
- 45 Sycamore Dr
- 1320 Sycamore Dr
- 1215 Pecan Ln
- 1218 Pecan Ln
- 16 Pecan Ln
- 1315 Elm Crest Cove
- 1324 Elm Crest Cove
- 1427 Walnut Rd