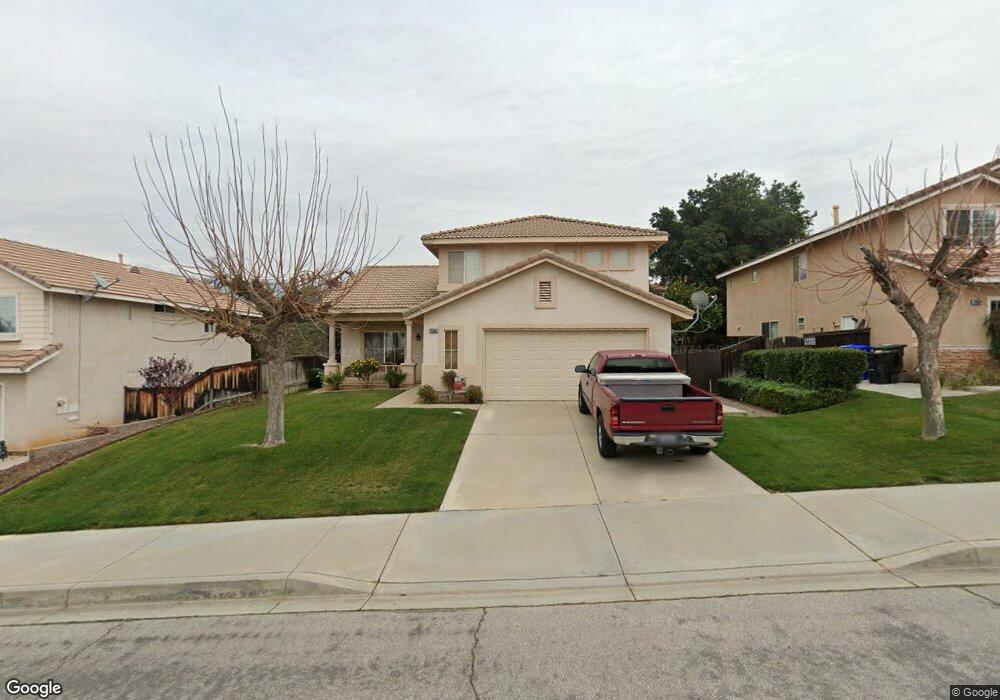
12595 Redstone Cir Yucaipa, CA 92399
Estimated Value: $564,847 - $634,000
4
Beds
3
Baths
1,766
Sq Ft
$343/Sq Ft
Est. Value
About This Home
This home is located at 12595 Redstone Cir, Yucaipa, CA 92399 and is currently estimated at $605,962, approximately $343 per square foot. 12595 Redstone Cir is a home located in San Bernardino County with nearby schools including Valley Elementary School, Mesa View Middle School, and Yucaipa High School.
Ownership History
Date
Name
Owned For
Owner Type
Purchase Details
Closed on
Nov 17, 2014
Sold by
Mostert Peter and Mostert Leslye
Bought by
Mostert Family Revocable Living Trust
Current Estimated Value
Home Financials for this Owner
Home Financials are based on the most recent Mortgage that was taken out on this home.
Original Mortgage
$285,800
Outstanding Balance
$219,737
Interest Rate
4.1%
Mortgage Type
New Conventional
Estimated Equity
$386,225
Purchase Details
Closed on
Feb 11, 2014
Sold by
Mostert Peter and Mostert Leslye E
Bought by
Mostert Peter and Mostert Leslye
Purchase Details
Closed on
Feb 7, 1996
Sold by
Centex Real Estate Corp
Bought by
Mostert Peter and Mostert Leslye E
Home Financials for this Owner
Home Financials are based on the most recent Mortgage that was taken out on this home.
Original Mortgage
$137,526
Interest Rate
7.01%
Mortgage Type
FHA
Create a Home Valuation Report for This Property
The Home Valuation Report is an in-depth analysis detailing your home's value as well as a comparison with similar homes in the area
Home Values in the Area
Average Home Value in this Area
Purchase History
| Date | Buyer | Sale Price | Title Company |
|---|---|---|---|
| Mostert Family Revocable Living Trust | -- | Accommodation | |
| Mostert Peter | -- | Lawyers Title Company | |
| Mostert Peter | -- | None Available | |
| Mostert Peter | $142,000 | Stewart Title |
Source: Public Records
Mortgage History
| Date | Status | Borrower | Loan Amount |
|---|---|---|---|
| Open | Mostert Peter | $285,800 | |
| Closed | Mostert Peter | $137,526 |
Source: Public Records
Tax History
| Year | Tax Paid | Tax Assessment Tax Assessment Total Assessment is a certain percentage of the fair market value that is determined by local assessors to be the total taxable value of land and additions on the property. | Land | Improvement |
|---|---|---|---|---|
| 2025 | $3,419 | $235,824 | $58,972 | $176,852 |
| 2024 | $3,326 | $231,200 | $57,816 | $173,384 |
| 2023 | $3,224 | $226,666 | $56,682 | $169,984 |
| 2022 | $3,414 | $222,222 | $55,571 | $166,651 |
| 2021 | $3,115 | $217,864 | $54,481 | $163,383 |
| 2020 | $3,345 | $215,630 | $53,922 | $161,708 |
| 2019 | $3,277 | $211,402 | $52,865 | $158,537 |
| 2018 | $2,883 | $207,256 | $51,828 | $155,428 |
| 2017 | $2,801 | $203,192 | $50,812 | $152,380 |
| 2016 | $2,771 | $199,208 | $49,816 | $149,392 |
| 2015 | $2,742 | $196,216 | $49,068 | $147,148 |
| 2014 | $2,704 | $192,373 | $48,107 | $144,266 |
Source: Public Records
Map
Nearby Homes
- 12730 8th St
- 33820 Plum Tree Ln
- 33460 Brushy Hollow Dr
- 33507 Colorado St
- 12319 Parkside Cir
- 33969 Avenue E
- 12721 Royal Oak Ct
- 33817 Liberty Rd
- 12449 6th St
- 33241 Avenue D
- 34027 Lily Rd
- 12816 Via Barcelona Rd
- 33379 Wallace Way
- 12300 5th St Unit 61
- 11964 Limestone Ct
- 12220 5th St Unit 142
- 12220 5th St Unit 193
- 12220 5th St Unit 205A
- 12220 5th St Unit 110
- 12220 5th St Unit 195
- 12585 Redstone Cir
- 12605 Redstone Cir
- 12575 Redstone Cir
- 33672 Avenue E
- 12615 Redstone Cir
- 12590 Redstone Cir
- 12565 Redstone Cir
- 12625 Redstone Cir
- 12580 Redstone Cir
- 12570 Redstone Cir
- 33620 Brushy Hollow Dr
- 12574 8th St
- 12555 Redstone Cir
- 12590 8th St
- 33625 Brushy Hollow Dr
- 33599 Terrie Way
- 12560 Redstone Cir
- 33610 Brushy Hollow Dr
- 12558 8th St
- 12545 Redstone Cir
Your Personal Tour Guide
Ask me questions while you tour the home.