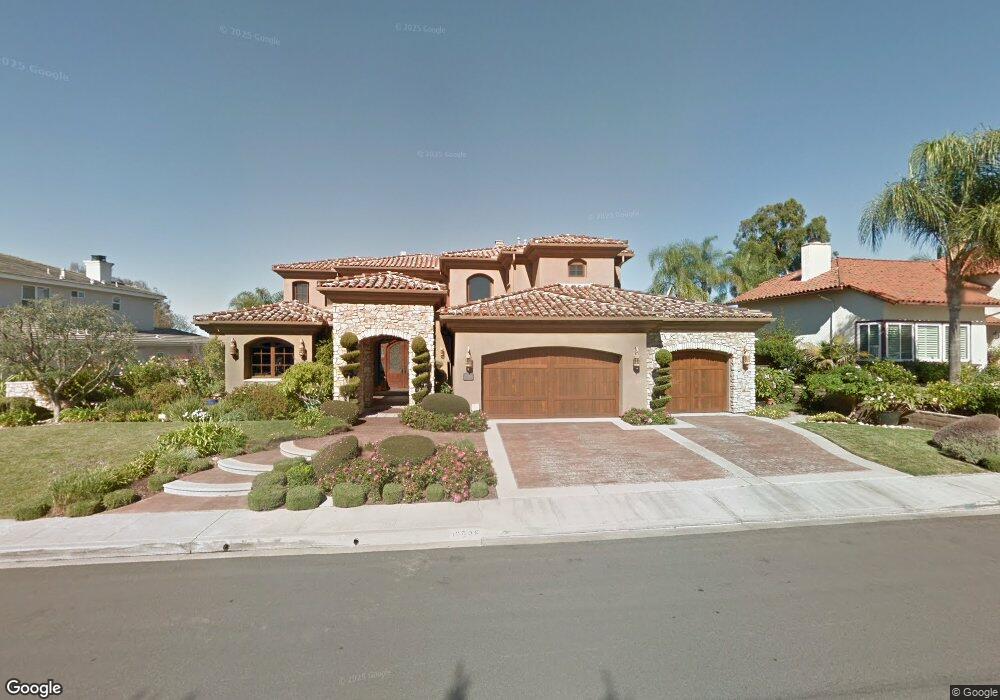
12596 Fairbrook Rd San Diego, CA 92131
Scripps Ranch NeighborhoodEstimated Value: $2,431,000 - $2,660,000
4
Beds
5
Baths
4,188
Sq Ft
$608/Sq Ft
Est. Value
About This Home
This home is located at 12596 Fairbrook Rd, San Diego, CA 92131 and is currently estimated at $2,548,051, approximately $608 per square foot. 12596 Fairbrook Rd is a home located in San Diego County with nearby schools including Jerabek Elementary School, Thurgood Marshall Middle School, and Scripps Ranch High School.
Ownership History
Date
Name
Owned For
Owner Type
Purchase Details
Closed on
Feb 16, 2017
Sold by
Serrano Marcus A and Serrano Lisa D
Bought by
Serrano Marcus A
Current Estimated Value
Purchase Details
Closed on
Jul 20, 2016
Sold by
Miller John S and Miller Linda
Bought by
Serrano Marcus A and Serrano Lisa D
Home Financials for this Owner
Home Financials are based on the most recent Mortgage that was taken out on this home.
Original Mortgage
$1,150,000
Interest Rate
3.41%
Mortgage Type
VA
Purchase Details
Closed on
Nov 24, 2004
Sold by
Cluff John Phillip and Cluff Williams Burns
Bought by
Miller John S and Miller Linda
Purchase Details
Closed on
Feb 19, 2004
Sold by
Cluff John Phillip and Cluff William Burns
Bought by
Cluff John Phillip and Cluff William Burns
Purchase Details
Closed on
May 29, 1985
Purchase Details
Closed on
Jul 19, 1983
Create a Home Valuation Report for This Property
The Home Valuation Report is an in-depth analysis detailing your home's value as well as a comparison with similar homes in the area
Home Values in the Area
Average Home Value in this Area
Purchase History
| Date | Buyer | Sale Price | Title Company |
|---|---|---|---|
| Serrano Marcus A | -- | None Available | |
| Serrano Marcus A | $1,450,000 | Corinthian Title Company | |
| Miller John S | $650,000 | First American Title Co | |
| Cluff John Phillip | -- | -- | |
| -- | $288,000 | -- | |
| -- | $229,900 | -- |
Source: Public Records
Mortgage History
| Date | Status | Borrower | Loan Amount |
|---|---|---|---|
| Previous Owner | Serrano Marcus A | $1,150,000 |
Source: Public Records
Tax History Compared to Growth
Tax History
| Year | Tax Paid | Tax Assessment Tax Assessment Total Assessment is a certain percentage of the fair market value that is determined by local assessors to be the total taxable value of land and additions on the property. | Land | Improvement |
|---|---|---|---|---|
| 2025 | $20,490 | $1,692,708 | $938,330 | $754,378 |
| 2024 | $20,490 | $1,659,519 | $919,932 | $739,587 |
| 2023 | $20,033 | $1,626,981 | $901,895 | $725,086 |
| 2022 | $19,493 | $1,595,080 | $884,211 | $710,869 |
| 2021 | $19,350 | $1,563,805 | $866,874 | $696,931 |
| 2020 | $19,114 | $1,547,771 | $857,986 | $689,785 |
| 2019 | $18,771 | $1,517,423 | $841,163 | $676,260 |
| 2018 | $17,550 | $1,487,670 | $824,670 | $663,000 |
| 2017 | $17,032 | $1,450,000 | $800,000 | $650,000 |
| 2016 | $14,452 | $1,225,000 | $601,000 | $624,000 |
| 2015 | $13,278 | $1,125,000 | $552,000 | $573,000 |
| 2014 | $12,443 | $1,050,000 | $516,000 | $534,000 |
Source: Public Records
Map
Nearby Homes
- 12516 Rougemont Place
- 10304 Spruce Grove Ave
- 10575 Spruce Grove Ave
- 11787 La Colina Rd
- 12026 Medoc Ln
- 11646 La Colina Rd
- 10405 White Birch Dr
- 10976 Caminito Alto
- 11393 Vista Elevada
- 12432 Caminito Brioso
- 10616 Falcon Rim Point
- 10415 Mesa Madera Dr
- 11495 Cypress Canyon Rd
- 11954 Cypress Valley Dr
- 11313 Wild Meadow Place
- 9950 Dichondra Place
- 10535 Arbor Park Place
- 13303 Greenstone Ct
- 11721 Treadwell Dr
- 11793 Alderhill Terrace
- 12606 Fairbrook Rd
- 12588 Fairbrook Rd
- 12614 Fairbrook Rd
- 12580 Fairbrook Rd
- 12605 Fairbrook Rd
- 12597 Fairbrook Rd
- 12611 Fairbrook Rd
- 12589 Fairbrook Rd
- 12572 Fairbrook Rd
- 12622 Fairbrook Rd
- 12619 Fairbrook Rd
- 12581 Fairbrook Rd
- 12564 Fairbrook Rd
- 12630 Fairbrook Rd
- 12573 Fairbrook Rd
- 12627 Fairbrook Rd
- 12558 Fairbrook Rd
- 12565 Fairbrook Rd
- 12638 Fairbrook Rd
- 12550 Fairbrook Rd