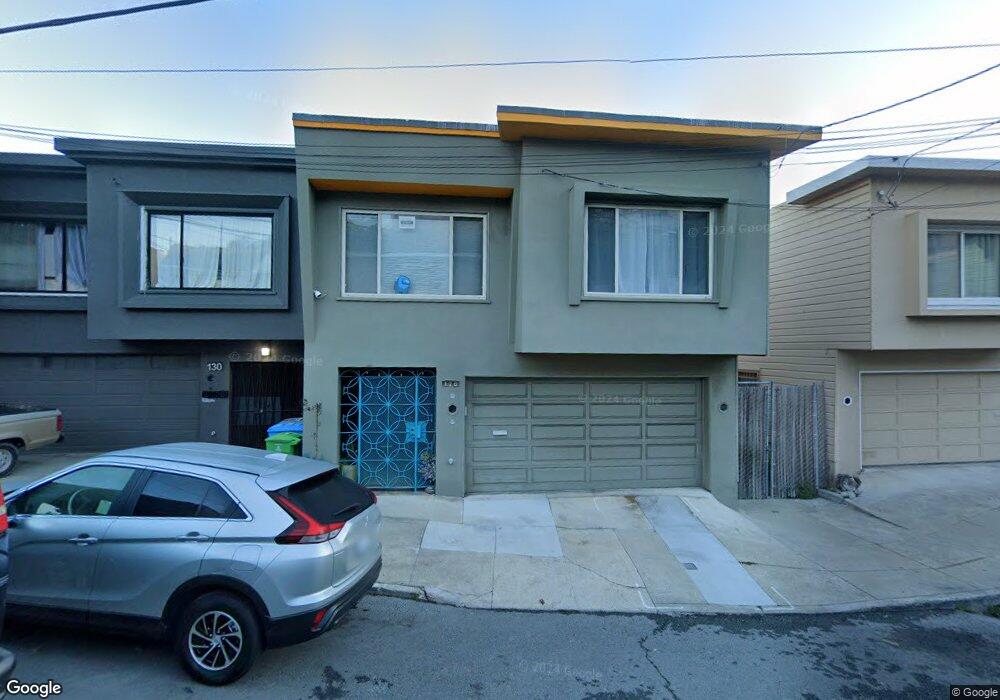
126 Bridgeview Dr San Francisco, CA 94124
Silver Terrace NeighborhoodEstimated Value: $993,000 - $1,084,797
3
Beds
2
Baths
1,404
Sq Ft
$736/Sq Ft
Est. Value
About This Home
This home is located at 126 Bridgeview Dr, San Francisco, CA 94124 and is currently estimated at $1,033,949, approximately $736 per square foot. 126 Bridgeview Dr is a home located in San Francisco County with nearby schools including Dr. Charles R. Drew College Preparatory Academy, Willie L. Brown Jr. Middle School, and KIPP San Francisco College Preparatory.
Ownership History
Date
Name
Owned For
Owner Type
Purchase Details
Closed on
Jan 6, 2021
Sold by
Yaghiuma Day Impossible and Yaginuma Mie Ann
Bought by
Yaghiuma Day Impossible and Yaghiuma Mie Ann
Current Estimated Value
Home Financials for this Owner
Home Financials are based on the most recent Mortgage that was taken out on this home.
Original Mortgage
$570,000
Outstanding Balance
$508,637
Interest Rate
2.7%
Mortgage Type
New Conventional
Estimated Equity
$525,312
Purchase Details
Closed on
Feb 18, 2014
Sold by
Gray Mark A and Gray Joyce W
Bought by
Yaginuma Dav and Yaginuma Mie
Home Financials for this Owner
Home Financials are based on the most recent Mortgage that was taken out on this home.
Original Mortgage
$67,400
Interest Rate
4.34%
Mortgage Type
Credit Line Revolving
Purchase Details
Closed on
Jun 26, 2009
Sold by
Gray Joyce W
Bought by
Gray Mark A and Gray Joyce W
Purchase Details
Closed on
Sep 12, 2000
Sold by
Brooks Ida M
Bought by
Brooks Ida Mae
Create a Home Valuation Report for This Property
The Home Valuation Report is an in-depth analysis detailing your home's value as well as a comparison with similar homes in the area
Home Values in the Area
Average Home Value in this Area
Purchase History
| Date | Buyer | Sale Price | Title Company |
|---|---|---|---|
| Yaghiuma Day Impossible | -- | Old Republic Title Company | |
| Yaginuma Dav | $705,000 | Stewart Title Of Ca Inc | |
| Gray Mark A | -- | None Available | |
| Brooks Ida Mae | -- | -- |
Source: Public Records
Mortgage History
| Date | Status | Borrower | Loan Amount |
|---|---|---|---|
| Open | Yaghiuma Day Impossible | $570,000 | |
| Closed | Yaginuma Dav | $67,400 | |
| Closed | Yaginuma Dav | $540,000 |
Source: Public Records
Tax History Compared to Growth
Tax History
| Year | Tax Paid | Tax Assessment Tax Assessment Total Assessment is a certain percentage of the fair market value that is determined by local assessors to be the total taxable value of land and additions on the property. | Land | Improvement |
|---|---|---|---|---|
| 2025 | $11,425 | $933,234 | $604,958 | $328,276 |
| 2024 | $11,425 | $914,937 | $593,097 | $321,840 |
| 2023 | $11,247 | $896,999 | $581,468 | $315,531 |
| 2022 | $11,025 | $879,412 | $570,067 | $309,345 |
| 2021 | $10,826 | $862,170 | $558,890 | $303,280 |
| 2020 | $10,883 | $853,331 | $553,160 | $300,171 |
| 2019 | $10,511 | $836,600 | $542,314 | $294,286 |
| 2018 | $10,156 | $820,197 | $531,681 | $288,516 |
| 2017 | $9,736 | $804,116 | $521,256 | $282,860 |
| 2016 | $8,878 | $730,050 | $511,036 | $219,014 |
| 2015 | $8,766 | $719,085 | $503,360 | $215,725 |
| 2014 | $1,075 | $62,712 | $21,084 | $41,628 |
Source: Public Records
Map
Nearby Homes
- 1887 Oakdale Ave
- 1947 Palou Ave
- 1699 Quint St
- 1697 Quint St
- 1539 Oakdale Ave
- 1789 Mckinnon Ave
- 1739 Quesada Ave
- 1773-1775 Mckinnon Ave
- 324 Topeka Ave
- 45 Scotia Ave
- 215 Thornton Ave
- 77 Reddy St
- 5264 3rd St Unit 303
- 1590 Underwood Ave
- 1484 Newcomb Ave
- 1537 Revere Ave
- 901 Bayshore Blvd Unit 311
- 4128 3rd St
- 1531 Jerrold Ave
- 1688 Wallace Ave Unit 304
- 122 Bridgeview Dr
- 134 Bridgeview Dr
- 118 Bridgeview Dr
- 138 Bridgeview Dr
- 114 Bridgeview Dr
- 142 Bridgeview Dr
- 110 Bridgeview Dr
- 146 Bridgeview Dr
- 1927 Quesada Ave
- 1931 Quesada Ave
- 150 Bridgeview Dr
- 106 Bridgeview Dr
- 1935 Quesada Ave
- 143 Bridgeview Dr
- 147 Bridgeview Dr
- 152 Bridgeview Dr
- 119 Bridgeview Dr
- 115 Bridgeview Dr
- 111 Bridgeview Dr
- 1939 Quesada Ave