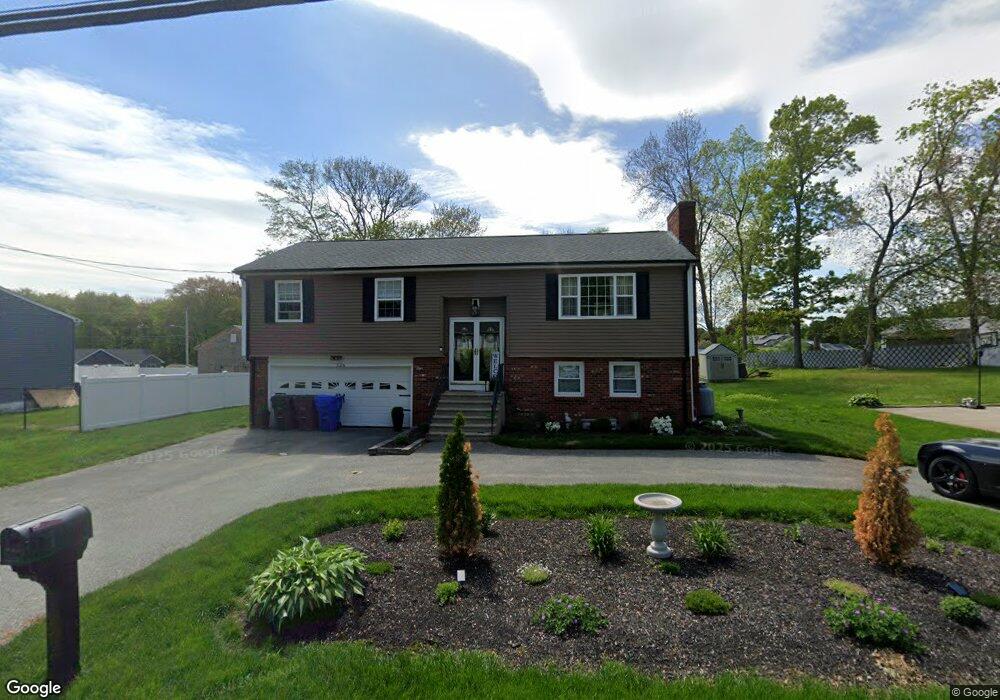
126 Burlingame Rd West Warwick, RI 02893
Lippitt-Harris NeighborhoodEstimated Value: $421,000 - $552,000
3
Beds
2
Baths
1,764
Sq Ft
$282/Sq Ft
Est. Value
About This Home
This home is located at 126 Burlingame Rd, West Warwick, RI 02893 and is currently estimated at $497,861, approximately $282 per square foot. 126 Burlingame Rd is a home located in Kent County with nearby schools including West Warwick High School, St Joseph School, and Islamic School of Rhode Island.
Ownership History
Date
Name
Owned For
Owner Type
Purchase Details
Closed on
Oct 4, 2024
Sold by
Petrarca Joseph M
Bought by
Petrarca Joseph M and Petrarca Melissa A
Current Estimated Value
Home Financials for this Owner
Home Financials are based on the most recent Mortgage that was taken out on this home.
Original Mortgage
$359,177
Outstanding Balance
$355,234
Interest Rate
6.12%
Mortgage Type
FHA
Estimated Equity
$142,627
Purchase Details
Closed on
Mar 6, 2019
Sold by
Petrarca Andre M Est and Petrarca
Bought by
Petrarca Joseph M
Home Financials for this Owner
Home Financials are based on the most recent Mortgage that was taken out on this home.
Original Mortgage
$177,960
Interest Rate
5.12%
Mortgage Type
FHA
Create a Home Valuation Report for This Property
The Home Valuation Report is an in-depth analysis detailing your home's value as well as a comparison with similar homes in the area
Home Values in the Area
Average Home Value in this Area
Purchase History
| Date | Buyer | Sale Price | Title Company |
|---|---|---|---|
| Petrarca Joseph M | -- | None Available | |
| Petrarca Joseph M | -- | None Available | |
| Petrarca Joseph M | $229,900 | -- | |
| Petrarca Joseph M | $229,900 | -- |
Source: Public Records
Mortgage History
| Date | Status | Borrower | Loan Amount |
|---|---|---|---|
| Open | Petrarca Joseph M | $359,177 | |
| Closed | Petrarca Joseph M | $359,177 | |
| Previous Owner | Petrarca Joseph M | $177,960 |
Source: Public Records
Tax History Compared to Growth
Tax History
| Year | Tax Paid | Tax Assessment Tax Assessment Total Assessment is a certain percentage of the fair market value that is determined by local assessors to be the total taxable value of land and additions on the property. | Land | Improvement |
|---|---|---|---|---|
| 2025 | $8,037 | $562,400 | $100,600 | $461,800 |
| 2024 | $7,257 | $388,300 | $84,300 | $304,000 |
| 2023 | $5,749 | $313,800 | $84,300 | $229,500 |
| 2022 | $5,304 | $294,000 | $84,300 | $209,700 |
| 2021 | $5,647 | $245,500 | $83,200 | $162,300 |
| 2020 | $5,647 | $245,500 | $83,200 | $162,300 |
| 2019 | $7,198 | $245,500 | $83,200 | $162,300 |
| 2018 | $5,219 | $197,600 | $81,600 | $116,000 |
| 2017 | $5,199 | $197,600 | $81,600 | $116,000 |
| 2016 | $5,106 | $197,600 | $81,600 | $116,000 |
| 2015 | $4,948 | $190,600 | $81,600 | $109,000 |
| 2014 | $1,210 | $190,600 | $81,600 | $109,000 |
Source: Public Records
Map
Nearby Homes
- 132 Burlingame Rd
- 120 Burlingame Rd
- 137 Burlingame Rd
- 39 Vincenzo Dr
- 136 Burlingame Rd
- 33 Vincenzo Dr
- 3 Countryside Way
- 143 Burlingame Rd
- 27 Vincenzo Dr
- 2 Countryside Way
- 149 Burlingame Rd
- 11 Bayview Dr
- 42 Vincenzo Dr
- 12 Bayview Dr
- 46 Vincenzo Dr
- 21 Vincenzo Dr
- 30 Vincenzo Dr
- 108 Burlingame Rd
- 24 Vincenzo Dr
- 146 Burlingame Rd