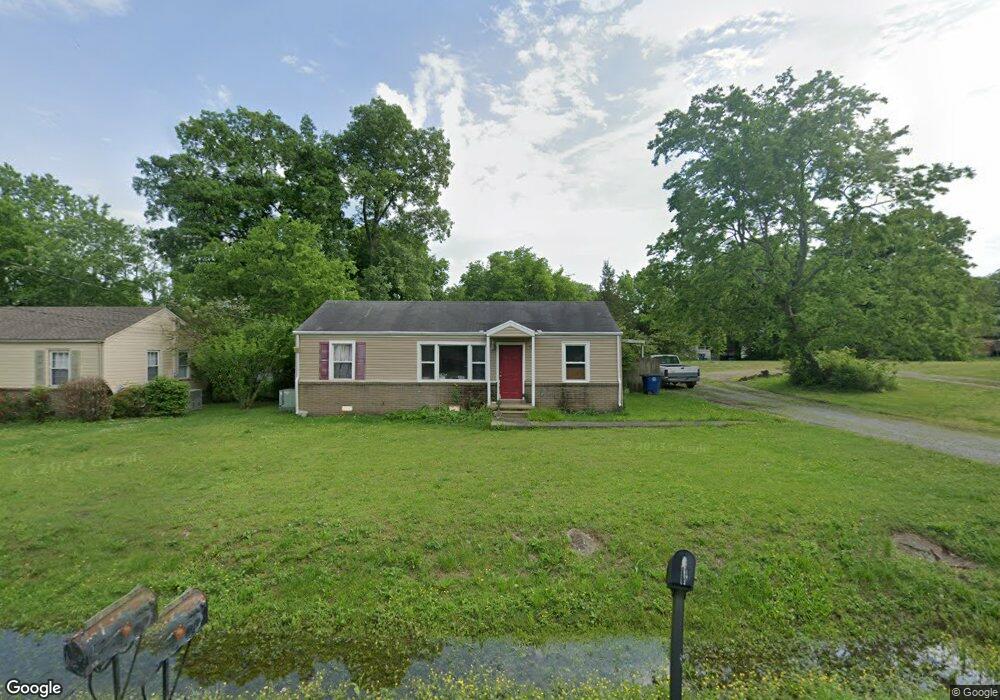
126 Butler St Shelbyville, TN 37160
Estimated Value: $162,815 - $251,000
--
Bed
1
Bath
1,440
Sq Ft
$139/Sq Ft
Est. Value
About This Home
This home is located at 126 Butler St, Shelbyville, TN 37160 and is currently estimated at $199,704, approximately $138 per square foot. 126 Butler St is a home located in Bedford County with nearby schools including Eakin Elementary School, Harris Middle School, and Victory Baptist Academy.
Ownership History
Date
Name
Owned For
Owner Type
Purchase Details
Closed on
Dec 30, 2009
Sold by
Dye Robert
Bought by
Frame James R
Current Estimated Value
Purchase Details
Closed on
Nov 19, 2008
Sold by
Allison Robert
Bought by
Dye Robert
Purchase Details
Closed on
Nov 13, 2008
Sold by
Holman Dorel Montoya
Bought by
Allison Robert
Purchase Details
Closed on
Jun 19, 2002
Sold by
Holman Sylver A
Bought by
Holman Dorel M
Purchase Details
Closed on
Aug 30, 2000
Sold by
Holt Development Llc
Bought by
Mielneczek Kay M
Purchase Details
Closed on
Jun 17, 2000
Sold by
Holman Sylver
Bought by
Holt Development Llc
Purchase Details
Closed on
Nov 12, 1996
Sold by
Holman Larrett
Bought by
Holman Sylver
Purchase Details
Closed on
Dec 14, 1987
Bought by
Holman Larrett
Purchase Details
Closed on
Nov 29, 1974
Bought by
Flowers Cleon A and Flowers Theresa P
Create a Home Valuation Report for This Property
The Home Valuation Report is an in-depth analysis detailing your home's value as well as a comparison with similar homes in the area
Home Values in the Area
Average Home Value in this Area
Purchase History
| Date | Buyer | Sale Price | Title Company |
|---|---|---|---|
| Frame James R | $76,000 | -- | |
| Dye Robert | -- | -- | |
| Allison Robert | $32,000 | -- | |
| Holman Dorel M | $39,000 | -- | |
| Mielneczek Kay M | $42,000 | -- | |
| Holt Development Llc | $39,000 | -- | |
| Holman Sylver | -- | -- | |
| Holman Larrett | $38,000 | -- | |
| Flowers Cleon A | -- | -- |
Source: Public Records
Tax History Compared to Growth
Tax History
| Year | Tax Paid | Tax Assessment Tax Assessment Total Assessment is a certain percentage of the fair market value that is determined by local assessors to be the total taxable value of land and additions on the property. | Land | Improvement |
|---|---|---|---|---|
| 2025 | -- | $21,150 | $0 | $0 |
| 2024 | -- | $21,150 | $3,925 | $17,225 |
| 2023 | $805 | $21,150 | $3,925 | $17,225 |
| 2022 | $828 | $21,150 | $3,925 | $17,225 |
| 2021 | $752 | $21,150 | $3,925 | $17,225 |
| 2020 | $691 | $21,150 | $3,925 | $17,225 |
| 2019 | $691 | $15,600 | $2,375 | $13,225 |
| 2018 | $675 | $15,600 | $2,375 | $13,225 |
| 2017 | $675 | $15,600 | $2,375 | $13,225 |
| 2016 | $669 | $15,600 | $2,375 | $13,225 |
| 2015 | $669 | $15,600 | $2,375 | $13,225 |
| 2014 | $619 | $15,796 | $0 | $0 |
Source: Public Records
Map
Nearby Homes
- 115 Scotland Heights
- 129 Annas Way
- 134 Butler St
- 114 Collier Ave
- 1017 Fairfield Pike
- 201 Hickory Dr
- 102 Saddlewood Dr
- 178 Lucas Rd
- 108 Thoroughbred Blvd
- 0 Archery Ln
- 1505 Green Ln
- 318 Meadow Dr
- 610 Sundance St
- 304 Lee Ln
- 1507 Green Ln
- 303 Lee Ln
- 1523 Green Ln
- 1525 Green Ln
- 1311 Glenoaks Rd
- 112 E Cedar St
- 128 Butler St
- 124 Butler St
- 201 Scotland Heights
- 130 Butler St
- 203 Scotland Heights
- 131 Butler St
- 122 Butler St
- 129 Scotland Heights
- 133 Butler St
- 205 Scotland Heights
- 129 Butler St
- 132 Butler St
- 135 Butler St
- 135 Butler St
- 127 Scotland Heights
- 120 Butler St
- 207 Scotland Heights
- 125 Butler St
- 137 Butler St
- 125 Scotland Heights