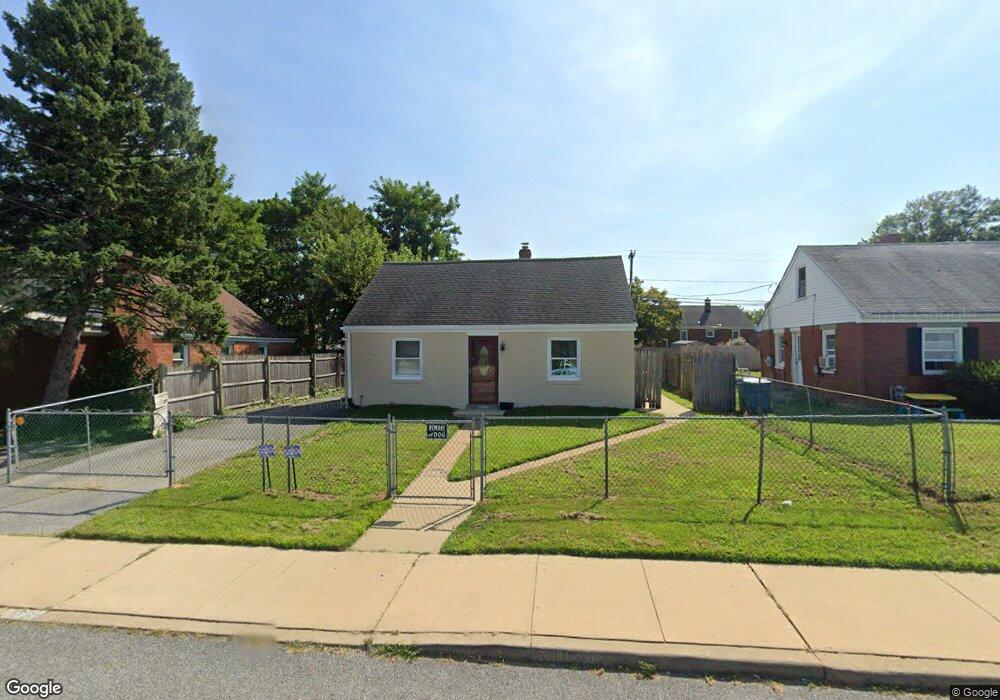
126 Cherry Ln New Castle, DE 19720
Estimated Value: $221,000 - $265,000
3
Beds
1
Bath
1,250
Sq Ft
$197/Sq Ft
Est. Value
About This Home
This home is located at 126 Cherry Ln, New Castle, DE 19720 and is currently estimated at $246,512, approximately $197 per square foot. 126 Cherry Ln is a home located in New Castle County with nearby schools including New Castle Elementary School, Calvin R. McCullough Middle School, and Charter School of New Castle.
Ownership History
Date
Name
Owned For
Owner Type
Purchase Details
Closed on
Oct 25, 2011
Sold by
Mcdermott Joyce E and Minnick Ronald G
Bought by
Mann Sherri
Current Estimated Value
Home Financials for this Owner
Home Financials are based on the most recent Mortgage that was taken out on this home.
Original Mortgage
$95,515
Outstanding Balance
$66,622
Interest Rate
4.5%
Mortgage Type
FHA
Estimated Equity
$179,890
Purchase Details
Closed on
Jan 9, 2004
Sold by
Minnick Mildred L and Minnick Ronald G
Bought by
Minnick Ronald G
Create a Home Valuation Report for This Property
The Home Valuation Report is an in-depth analysis detailing your home's value as well as a comparison with similar homes in the area
Home Values in the Area
Average Home Value in this Area
Purchase History
| Date | Buyer | Sale Price | Title Company |
|---|---|---|---|
| Mann Sherri | $98,000 | None Available | |
| Minnick Ronald G | -- | -- |
Source: Public Records
Mortgage History
| Date | Status | Borrower | Loan Amount |
|---|---|---|---|
| Open | Mann Sherri | $95,515 |
Source: Public Records
Tax History Compared to Growth
Tax History
| Year | Tax Paid | Tax Assessment Tax Assessment Total Assessment is a certain percentage of the fair market value that is determined by local assessors to be the total taxable value of land and additions on the property. | Land | Improvement |
|---|---|---|---|---|
| 2024 | $1,263 | $36,800 | $5,100 | $31,700 |
| 2023 | $1,149 | $36,800 | $5,100 | $31,700 |
| 2022 | $1,196 | $36,800 | $5,100 | $31,700 |
| 2021 | $1,196 | $36,800 | $5,100 | $31,700 |
| 2020 | $1,203 | $36,800 | $5,100 | $31,700 |
| 2019 | $1,444 | $36,800 | $5,100 | $31,700 |
| 2018 | $1,179 | $36,800 | $5,100 | $31,700 |
| 2017 | $1,103 | $36,800 | $5,100 | $31,700 |
| 2016 | $987 | $36,800 | $5,100 | $31,700 |
| 2015 | $987 | $36,800 | $5,100 | $31,700 |
| 2014 | $988 | $36,800 | $5,100 | $31,700 |
Source: Public Records
Map
Nearby Homes