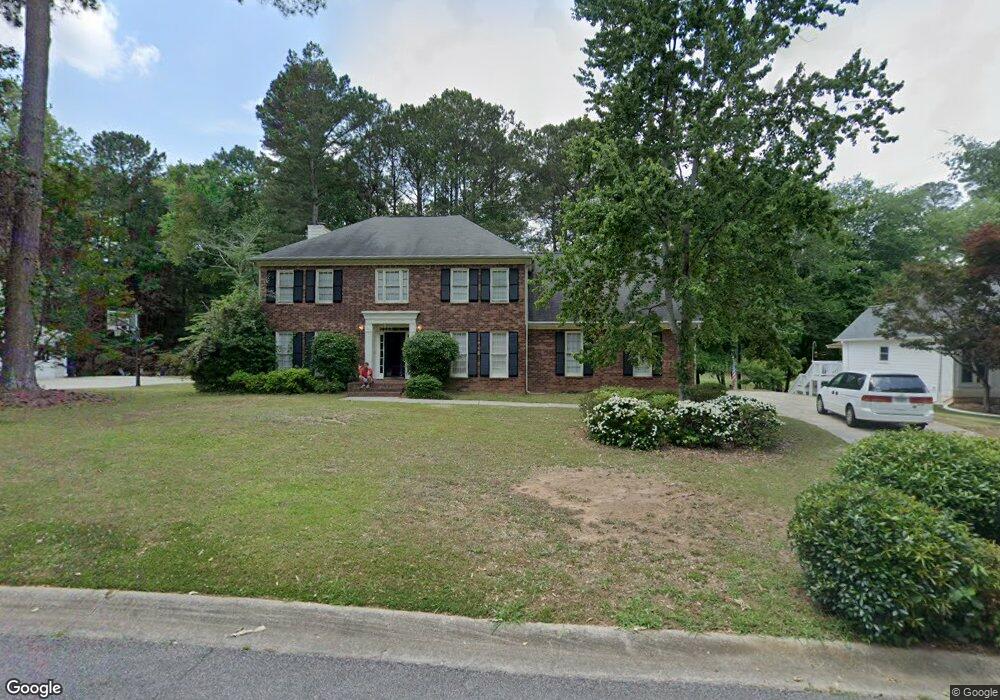
126 Colonnade Dr Unit 1 Peachtree City, GA 30269
Estimated Value: $507,000 - $665,000
--
Bed
--
Bath
3,296
Sq Ft
$174/Sq Ft
Est. Value
About This Home
This home is located at 126 Colonnade Dr Unit 1, Peachtree City, GA 30269 and is currently estimated at $572,667, approximately $173 per square foot. 126 Colonnade Dr Unit 1 is a home located in Fayette County with nearby schools including Braelinn Elementary School, Rising Starr Middle School, and Starrs Mill High School.
Ownership History
Date
Name
Owned For
Owner Type
Purchase Details
Closed on
May 31, 2023
Sold by
Marhefka Christopher G
Bought by
Gallaghan Rachael Lin
Current Estimated Value
Home Financials for this Owner
Home Financials are based on the most recent Mortgage that was taken out on this home.
Original Mortgage
$408,500
Outstanding Balance
$397,577
Interest Rate
6.39%
Mortgage Type
New Conventional
Estimated Equity
$175,090
Purchase Details
Closed on
Feb 24, 2017
Sold by
Marhefka Russell E
Bought by
Vandenbosch Kristi D and Marhefka Christopher G
Purchase Details
Closed on
Sep 1, 2011
Sold by
Marhefka Dorothy T
Bought by
Marhefka Russell E
Purchase Details
Closed on
May 31, 1994
Sold by
Holden William Danny
Bought by
Stanford Cindy
Home Financials for this Owner
Home Financials are based on the most recent Mortgage that was taken out on this home.
Original Mortgage
$150,000
Interest Rate
8.46%
Create a Home Valuation Report for This Property
The Home Valuation Report is an in-depth analysis detailing your home's value as well as a comparison with similar homes in the area
Home Values in the Area
Average Home Value in this Area
Purchase History
| Date | Buyer | Sale Price | Title Company |
|---|---|---|---|
| Gallaghan Rachael Lin | $430,000 | None Listed On Document | |
| Vandenbosch Kristi D | $360,000 | -- | |
| Marhefka Russell E | -- | -- | |
| Stanford Cindy | $215,000 | -- |
Source: Public Records
Mortgage History
| Date | Status | Borrower | Loan Amount |
|---|---|---|---|
| Open | Gallaghan Rachael Lin | $408,500 | |
| Previous Owner | Stanford Cindy | $150,000 |
Source: Public Records
Tax History Compared to Growth
Tax History
| Year | Tax Paid | Tax Assessment Tax Assessment Total Assessment is a certain percentage of the fair market value that is determined by local assessors to be the total taxable value of land and additions on the property. | Land | Improvement |
|---|---|---|---|---|
| 2024 | $5,084 | $172,000 | $25,240 | $146,760 |
| 2023 | $6,401 | $210,980 | $32,300 | $178,680 |
| 2022 | $6,109 | $201,700 | $32,300 | $169,400 |
| 2021 | $5,320 | $173,180 | $32,300 | $140,880 |
| 2020 | $5,275 | $169,900 | $32,300 | $137,600 |
| 2019 | $5,239 | $167,100 | $32,300 | $134,800 |
| 2018 | $4,588 | $144,000 | $29,120 | $114,880 |
| 2017 | $3,536 | $164,420 | $32,300 | $132,120 |
| 2016 | $3,231 | $143,220 | $32,300 | $110,920 |
| 2015 | $3,059 | $133,420 | $32,300 | $101,120 |
| 2014 | $2,849 | $121,820 | $32,300 | $89,520 |
| 2013 | -- | $116,660 | $0 | $0 |
Source: Public Records
Map
Nearby Homes
- 127 Kenton Place
- 212 Bella Rosa
- 100 Endicott Ridge
- 128 Rubicon Rd
- 110 Tamerlane
- 224 Felspar Ridge
- 318 Marble Ct
- 121 Tamerlane
- 423 Holly Grove Church Rd
- 1103 Iveydale Ln
- 313 Evian Way
- 418 Holly Brook Ln
- 155 W Creek Ct
- 367 Aster Ridge Trail
- 610 Napier Pass
- 220 Lavender Oasis
- 502 Whittington Way
- 106 Holly Springs Dr
- 209 Monticello Place Unit I
- 1017 Pinehurst Dr
- 124 Colonnade Dr
- 128 Colonnade Dr Unit 1
- 122 Colonnade Dr
- 302 Arcade Ct Unit 58
- 302 Arcade Ct
- 302 Arcade Ct Unit 1
- 125 Colonnade Dr
- 127 Colonnade Dr
- 0 Arcade Ct Unit 8586458
- 123 Colonnade Dr
- 120 Colonnade Dr
- 121 Colonnade Dr
- 129 Colonnade Dr Unit 1
- 304 Arcade Ct
- 403 Dublin Dr
- 301 Arcade Ct
- 119 Colonnade Dr Unit 1
- 118 Colonnade Dr
- 127 Chadwick Dr
- 303 Arcade Ct