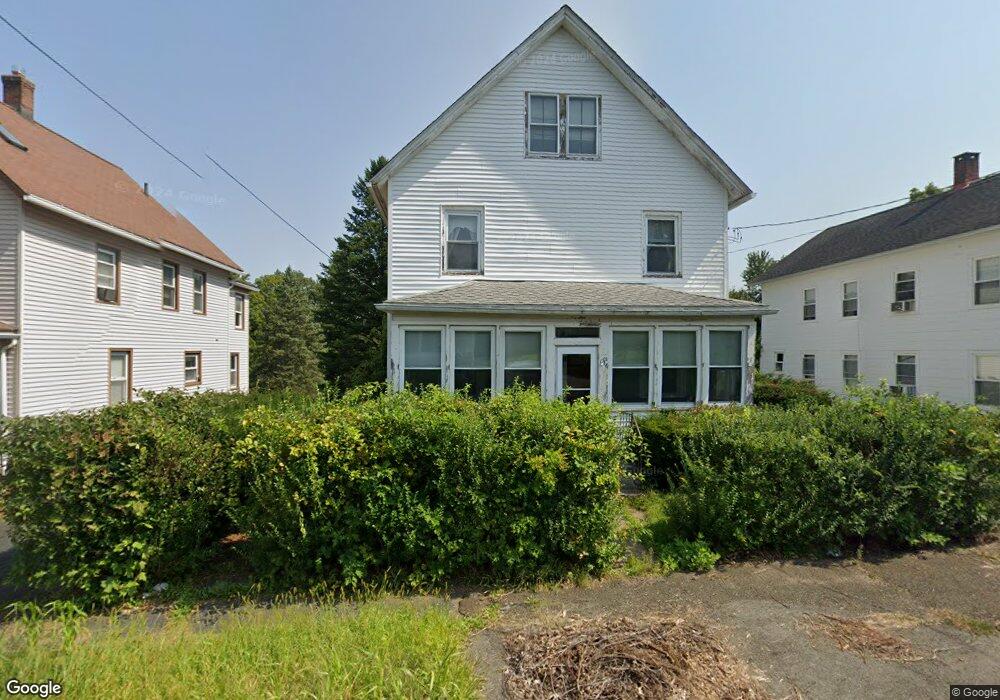
126 Front St Middletown, CT 06457
Estimated Value: $272,000 - $347,000
5
Beds
2
Baths
1,050
Sq Ft
$281/Sq Ft
Est. Value
About This Home
This home is located at 126 Front St, Middletown, CT 06457 and is currently estimated at $294,710, approximately $280 per square foot. 126 Front St is a home located in Middlesex County with nearby schools including Farm Hill School, Middletown High School, and St John Paul II School.
Ownership History
Date
Name
Owned For
Owner Type
Purchase Details
Closed on
Feb 24, 2025
Sold by
Lamalfa Anthony and Lamalfa Michael A
Bought by
Bell Point Llc
Current Estimated Value
Home Financials for this Owner
Home Financials are based on the most recent Mortgage that was taken out on this home.
Original Mortgage
$212,000
Outstanding Balance
$210,772
Interest Rate
7.04%
Mortgage Type
Commercial
Estimated Equity
$83,938
Create a Home Valuation Report for This Property
The Home Valuation Report is an in-depth analysis detailing your home's value as well as a comparison with similar homes in the area
Purchase History
| Date | Buyer | Sale Price | Title Company |
|---|---|---|---|
| Bell Point Llc | $33,144 | None Available | |
| Bell Point Llc | $33,144 | None Available |
Source: Public Records
Mortgage History
| Date | Status | Borrower | Loan Amount |
|---|---|---|---|
| Open | Bell Point Llc | $212,000 | |
| Closed | Bell Point Llc | $212,000 |
Source: Public Records
Tax History
| Year | Tax Paid | Tax Assessment Tax Assessment Total Assessment is a certain percentage of the fair market value that is determined by local assessors to be the total taxable value of land and additions on the property. | Land | Improvement |
|---|---|---|---|---|
| 2025 | $5,296 | $143,080 | $56,820 | $86,260 |
| 2024 | $5,067 | $143,080 | $56,820 | $86,260 |
| 2023 | $4,809 | $143,080 | $56,820 | $86,260 |
| 2022 | $4,079 | $99,320 | $37,880 | $61,440 |
| 2021 | $4,079 | $99,320 | $37,880 | $61,440 |
| 2020 | $0 | $99,320 | $37,880 | $61,440 |
| 2019 | $0 | $99,320 | $37,880 | $61,440 |
| 2018 | $3,951 | $99,320 | $37,880 | $61,440 |
| 2017 | $57 | $108,500 | $45,350 | $63,150 |
| 2016 | $4,113 | $108,500 | $45,350 | $63,150 |
| 2015 | $4,022 | $108,500 | $45,350 | $63,150 |
| 2014 | $4,018 | $108,500 | $45,350 | $63,150 |
Source: Public Records
Map
Nearby Homes
- 6 Hillside Ct
- 5 Wall St
- 42 Saybrook Rd
- 6 Bidwell Terrace
- 1 Jefferson Ave
- 37 Dobson Cir
- 58 Durant Terrace
- 63 Millbrook Rd
- 11 Mansfield Terrace
- 50 Cedar St
- 8 Macdonough Place
- 28 Kent Ct
- 111 Dekoven Dr Unit 506
- 909 Randolph Rd
- 201 College St Unit 26
- 208 Highmeadow Ln
- 180 Randolph Rd
- 54 Washington St
- 480 Main St
- 57 Ferry St
Your Personal Tour Guide
Ask me questions while you tour the home.