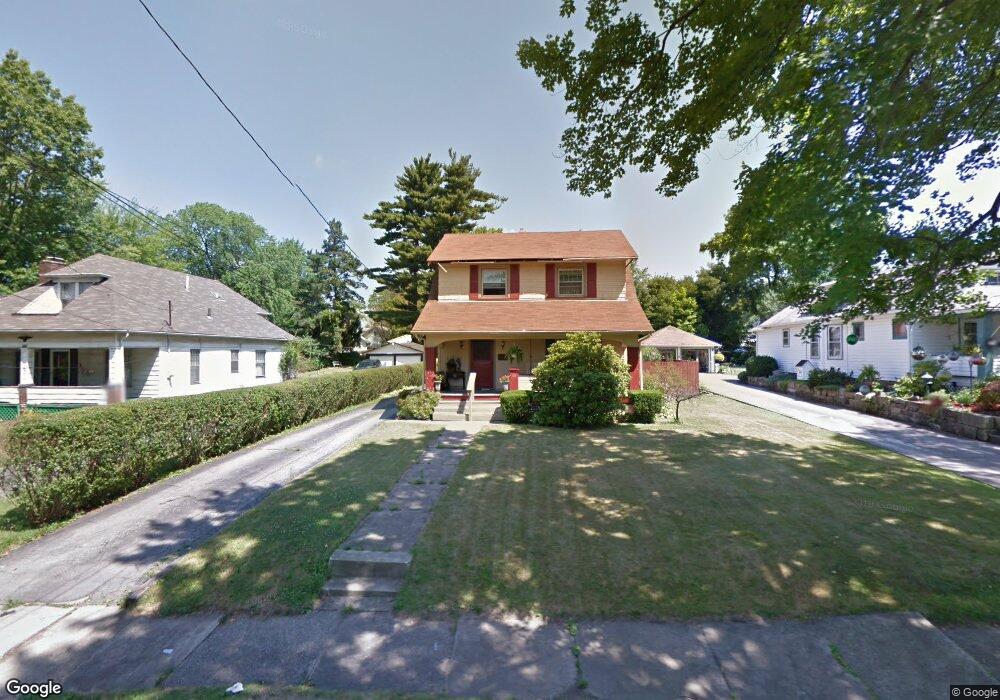
126 Lowell Ave Youngstown, OH 44512
Estimated Value: $81,417 - $162,000
4
Beds
2
Baths
1,760
Sq Ft
$61/Sq Ft
Est. Value
About This Home
This home is located at 126 Lowell Ave, Youngstown, OH 44512 and is currently estimated at $107,354, approximately $60 per square foot. 126 Lowell Ave is a home located in Mahoning County with nearby schools including Taft Elementary School, East High School, and Horizon Science Academy - Youngstown.
Ownership History
Date
Name
Owned For
Owner Type
Purchase Details
Closed on
Apr 28, 2023
Bought by
Lima Alberto
Current Estimated Value
Purchase Details
Closed on
Apr 16, 2023
Sold by
Nicholson Michael
Bought by
Lima Alberto and Magana Dania L
Purchase Details
Closed on
Mar 10, 2023
Bought by
Lima Alberto
Purchase Details
Closed on
Mar 7, 2023
Sold by
Staaf Michael and Staaf Julie
Bought by
Nicholson Michael
Purchase Details
Closed on
Apr 15, 2022
Sold by
Staaf Dorothy A
Bought by
Staaf Michael and Sakmar Julie
Purchase Details
Closed on
Oct 11, 1995
Sold by
Popovich Paul G
Bought by
Staaf Dorothy A
Home Financials for this Owner
Home Financials are based on the most recent Mortgage that was taken out on this home.
Original Mortgage
$36,800
Interest Rate
7.8%
Mortgage Type
New Conventional
Purchase Details
Closed on
Aug 25, 1971
Bought by
Popovich Paul G and Popovich Elaine
Create a Home Valuation Report for This Property
The Home Valuation Report is an in-depth analysis detailing your home's value as well as a comparison with similar homes in the area
Home Values in the Area
Average Home Value in this Area
Purchase History
| Date | Buyer | Sale Price | Title Company |
|---|---|---|---|
| Lima Alberto | $50,000 | -- | |
| Lima Alberto | $150,000 | Titleco Title | |
| Lima Alberto | $25,000 | -- | |
| Nicholson Michael | $25,000 | None Listed On Document | |
| Staaf Michael | -- | -- | |
| Staff Michael | -- | -- | |
| Staaf Dorothy A | $46,000 | -- | |
| Popovich Paul G | -- | -- |
Source: Public Records
Mortgage History
| Date | Status | Borrower | Loan Amount |
|---|---|---|---|
| Previous Owner | Staaf Dorothy A | $36,800 |
Source: Public Records
Tax History Compared to Growth
Tax History
| Year | Tax Paid | Tax Assessment Tax Assessment Total Assessment is a certain percentage of the fair market value that is determined by local assessors to be the total taxable value of land and additions on the property. | Land | Improvement |
|---|---|---|---|---|
| 2024 | $929 | $18,990 | $2,820 | $16,170 |
| 2023 | $922 | $18,990 | $2,820 | $16,170 |
| 2022 | $817 | $12,950 | $2,850 | $10,100 |
| 2021 | $796 | $12,950 | $2,850 | $10,100 |
| 2020 | $801 | $12,950 | $2,850 | $10,100 |
| 2019 | $805 | $11,660 | $2,560 | $9,100 |
| 2018 | $853 | $11,660 | $2,560 | $9,100 |
| 2017 | $810 | $11,660 | $2,560 | $9,100 |
| 2016 | $726 | $11,240 | $3,070 | $8,170 |
| 2015 | $711 | $11,240 | $3,070 | $8,170 |
| 2014 | $706 | $11,240 | $3,070 | $8,170 |
| 2013 | $696 | $11,240 | $3,070 | $8,170 |
Source: Public Records
Map
Nearby Homes
- 4144 Helena Ave
- 4307 Helena Ave
- 204 Lowell Ave
- 4312 Helena Ave
- 188 Clarencedale Ave
- 230 Clarencedale Ave
- 3916 Howard St
- 4504 Southern Blvd
- 4508 Southern Blvd
- 30 Pinehurst Ave
- 94 Shadyside Dr
- 60 Shadyside Dr
- 116 Hilton Ave
- 94 Beechwood Dr
- 131 E Ravenwood Ave Unit 133
- 83 Beechwood Dr
- 159 E Ravenwood Ave
- 148 Clifton Dr
- 4038 Sunset Blvd
- 365 E Midlothian Blvd
- 122 Lowell Ave
- 130 Lowell Ave
- 116 Lowell Ave
- 134 Lowell Ave
- 140 Lowell Ave
- 125 Hollywood Ave
- 129 Hollywood Ave
- 121 Hollywood Ave
- 4133 Southern Blvd
- 4127 Southern Blvd
- 115 Hollywood Ave
- 4135 Southern Blvd
- 135 Hollywood Ave
- 4123 Southern Blvd
- 144 Lowell Ave
- 121 Lowell Ave
- 4119 Southern Blvd
- 115 Lowell Ave
- 129 Lowell Ave
- 139 Hollywood Ave