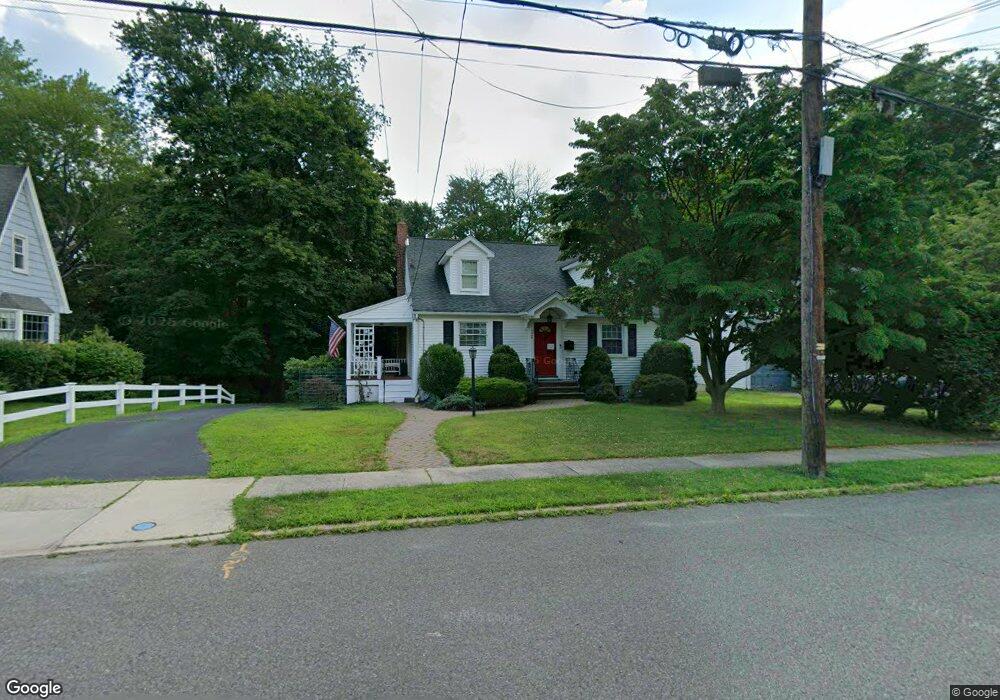
126 Maple St Ramsey, NJ 07446
Estimated Value: $695,000 - $861,000
Studio
--
Bath
1,497
Sq Ft
$512/Sq Ft
Est. Value
About This Home
This home is located at 126 Maple St, Ramsey, NJ 07446 and is currently estimated at $766,532, approximately $512 per square foot. 126 Maple St is a home located in Bergen County with nearby schools including Ramsey High School and Young World Day School.
Ownership History
Date
Name
Owned For
Owner Type
Purchase Details
Closed on
Aug 1, 2016
Sold by
Hark William B and Sobeck Regina
Bought by
Maehrlein Joseph P and Maehrlein Margaret
Current Estimated Value
Purchase Details
Closed on
Aug 13, 2009
Sold by
Tremblay Ryan
Bought by
Hark William B and Sobeck Regina
Home Financials for this Owner
Home Financials are based on the most recent Mortgage that was taken out on this home.
Original Mortgage
$439,450
Interest Rate
5.17%
Mortgage Type
Purchase Money Mortgage
Purchase Details
Closed on
Sep 1, 2006
Sold by
Sage Letitia L
Bought by
Tremblay Ryan
Home Financials for this Owner
Home Financials are based on the most recent Mortgage that was taken out on this home.
Original Mortgage
$372,000
Interest Rate
6.47%
Create a Home Valuation Report for This Property
The Home Valuation Report is an in-depth analysis detailing your home's value as well as a comparison with similar homes in the area
Home Values in the Area
Average Home Value in this Area
Purchase History
| Date | Buyer | Sale Price | Title Company |
|---|---|---|---|
| Maehrlein Joseph P | $550,000 | Westcor Land Title Insurance | |
| Hark William B | $550,000 | -- | |
| Tremblay Ryan | $465,000 | -- |
Source: Public Records
Mortgage History
| Date | Status | Borrower | Loan Amount |
|---|---|---|---|
| Previous Owner | Hark William B | $439,450 | |
| Previous Owner | Tremblay Ryan | $372,000 |
Source: Public Records
Tax History
| Year | Tax Paid | Tax Assessment Tax Assessment Total Assessment is a certain percentage of the fair market value that is determined by local assessors to be the total taxable value of land and additions on the property. | Land | Improvement |
|---|---|---|---|---|
| 2025 | $14,138 | $595,300 | $373,100 | $222,200 |
| 2024 | $13,712 | $501,000 | $307,100 | $193,900 |
| 2023 | $13,141 | $501,000 | $307,100 | $193,900 |
| 2022 | $13,141 | $501,000 | $307,100 | $193,900 |
| 2021 | $12,991 | $501,000 | $307,100 | $193,900 |
| 2020 | $12,876 | $501,000 | $307,100 | $193,900 |
| 2019 | $12,315 | $501,000 | $307,100 | $193,900 |
| 2018 | $12,009 | $501,000 | $307,100 | $193,900 |
| 2017 | $11,784 | $501,000 | $307,100 | $193,900 |
| 2016 | $11,081 | $484,500 | $307,100 | $177,400 |
| 2015 | $10,661 | $394,700 | $252,100 | $142,600 |
| 2014 | $10,479 | $394,700 | $252,100 | $142,600 |
Source: Public Records
Map
Nearby Homes
- 122 Orchard Place
- 92 W Main St
- 96 W Main St
- 98 W Main St
- 44 N Central Ave
- 46 Cherry Ln
- 89 Church St
- 28 North St
- 5306 Christopher St
- 903 Washington Dr
- 210 Washington Dr
- 41 Ramsey Ave
- 199 Darlington Ave
- 141 W Oak St
- 75 Cherokee Ave
- 61 Beech St
- 15 Old Oak Dr
- 19 Crescent Hollow Ct
- 121 Regency Park
- 33 Sherwood Dr
Your Personal Tour Guide
Ask me questions while you tour the home.