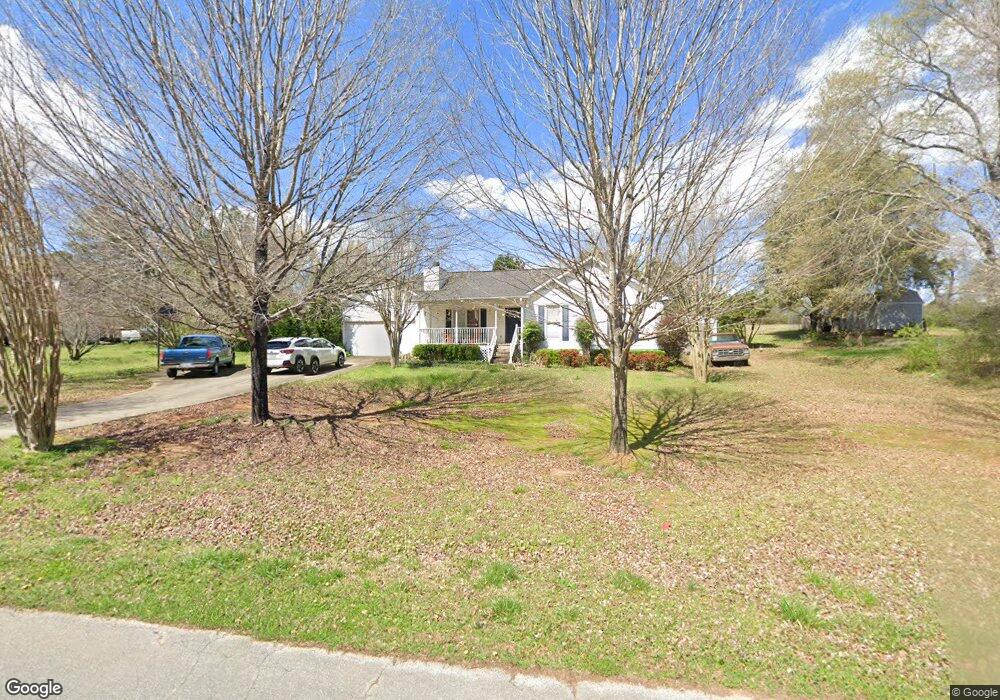
126 Michael Blvd Cedartown, GA 30125
Estimated Value: $247,000 - $288,000
3
Beds
2
Baths
1,450
Sq Ft
$188/Sq Ft
Est. Value
About This Home
This home is located at 126 Michael Blvd, Cedartown, GA 30125 and is currently estimated at $272,271, approximately $187 per square foot. 126 Michael Blvd is a home located in Polk County with nearby schools including Vineyard Harvester Christian Academy and Cedar Christian School.
Ownership History
Date
Name
Owned For
Owner Type
Purchase Details
Closed on
Mar 30, 2006
Sold by
Not Provided
Bought by
Junthongpipat N and Matthews Andru J
Current Estimated Value
Home Financials for this Owner
Home Financials are based on the most recent Mortgage that was taken out on this home.
Original Mortgage
$80,000
Outstanding Balance
$44,913
Interest Rate
6.25%
Mortgage Type
New Conventional
Estimated Equity
$227,358
Purchase Details
Closed on
Aug 27, 2001
Sold by
Knott Tammy L N and Knott K
Bought by
Owens David and Joy Owens
Purchase Details
Closed on
Mar 4, 1999
Sold by
Montgomery Thomas L
Bought by
Knott Tammy L
Purchase Details
Closed on
Nov 30, 1998
Sold by
Liverant Jacob
Bought by
Montgomery Thomas L
Purchase Details
Closed on
Apr 14, 1995
Sold by
Igel Stanley
Bought by
Igel Stanley Living Trus (Stanley Igel T
Purchase Details
Closed on
Oct 30, 1973
Bought by
Igel Stanley
Create a Home Valuation Report for This Property
The Home Valuation Report is an in-depth analysis detailing your home's value as well as a comparison with similar homes in the area
Purchase History
| Date | Buyer | Sale Price | Title Company |
|---|---|---|---|
| Junthongpipat N | $116,900 | -- | |
| Owens David | $112,000 | -- | |
| Knott Tammy L | $89,900 | -- | |
| Montgomery Thomas L | $4,000 | -- | |
| Igel Stanley Living Trus (Stanley Igel T | -- | -- | |
| Igel Stanley | -- | -- |
Source: Public Records
Mortgage History
| Date | Status | Borrower | Loan Amount |
|---|---|---|---|
| Open | Junthongpipat N | $80,000 |
Source: Public Records
Tax History
| Year | Tax Paid | Tax Assessment Tax Assessment Total Assessment is a certain percentage of the fair market value that is determined by local assessors to be the total taxable value of land and additions on the property. | Land | Improvement |
|---|---|---|---|---|
| 2025 | $2,083 | $98,840 | $15,200 | $83,640 |
| 2024 | $2,083 | $99,640 | $16,000 | $83,640 |
| 2023 | $1,659 | $69,896 | $16,000 | $53,896 |
| 2022 | $1,153 | $50,584 | $4,140 | $46,444 |
| 2021 | $1,168 | $50,584 | $4,140 | $46,444 |
| 2020 | $1,170 | $50,584 | $4,140 | $46,444 |
| 2019 | $1,259 | $48,873 | $4,000 | $44,873 |
| 2018 | $1,217 | $46,150 | $4,000 | $42,150 |
| 2017 | $1,201 | $46,150 | $4,000 | $42,150 |
| 2016 | $1,201 | $46,150 | $4,000 | $42,150 |
| 2015 | $1,212 | $46,408 | $4,000 | $42,408 |
| 2014 | $1,223 | $46,495 | $4,338 | $42,158 |
Source: Public Records
Map
Nearby Homes
- 387 Michael Blvd
- 354 Michael Blvd
- 914 Chubbtown Rd
- 0 Cave Spring Rd Unit 10631588
- 0 Cave Spring Rd Unit 7671027
- 1200 N Cave Spring St
- 727 Cherokee Rd
- 88 Sequoyah Ct
- 217 Cherokee Cir
- LOT 21 Cherokee Cir
- 8 Stonegate Dr
- 208 Silverthorn Way
- 39 Summerwind Dr
- 621 N College Dr
- 0 Santa Claus Rd Unit 7706526
- 0 Santa Claus Rd Unit 10676218
- 1544 Dry Creek Rd
- 75 Weaver Rd
- 0 Collins Rd Unit 10627302
- 232 Stephens Rd
- 116 Michael Blvd
- 136 Michael Blvd
- 40 Michael Blvd
- 153 Michael Blvd
- 92 Michael Blvd
- 111 Lee Ave
- 100 Lee Ave
- 188 Michael Blvd
- 189 Michael Blvd
- 80 Lee Ave
- 200 Michael Blvd
- 66 Michael Blvd
- 191 Michael Blvd
- 51 Lee Ave
- 68 Lee Ave
- 37 Michael Blvd
- 230 Michael Blvd
- 62 Michael Blvd Unit 21
- 46 Michael Blvd
- 62 Michael Blvd
Your Personal Tour Guide
Ask me questions while you tour the home.