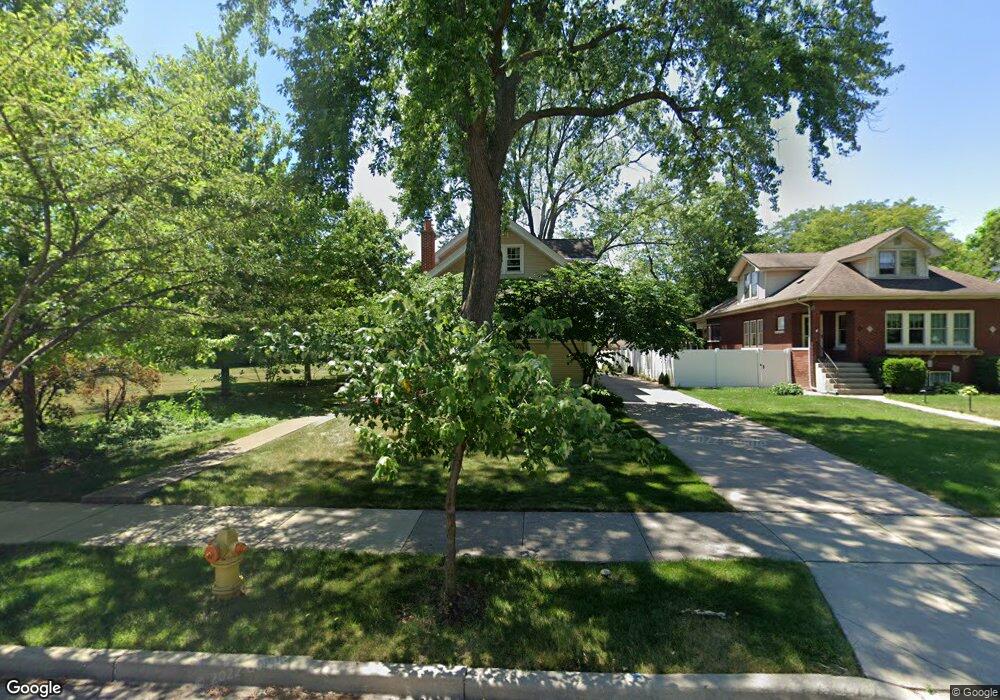
126 N Clinton Ave Elmhurst, IL 60126
Estimated Value: $689,067 - $743,000
--
Bed
--
Bath
1,993
Sq Ft
$359/Sq Ft
Est. Value
About This Home
This home is located at 126 N Clinton Ave, Elmhurst, IL 60126 and is currently estimated at $716,017, approximately $359 per square foot. 126 N Clinton Ave is a home located in DuPage County with nearby schools including Ruggles Elementary School, Field Elementary School, and Sandburg Middle School.
Ownership History
Date
Name
Owned For
Owner Type
Purchase Details
Closed on
Nov 6, 2015
Sold by
Morrow Jeffrey G
Bought by
Fabbri Morrow Paula A and Paula A Fabbri Morrow Living Trust
Current Estimated Value
Purchase Details
Closed on
Nov 24, 2000
Sold by
Morrow Jeffrey G and Fabbri Morrow Paula A
Bought by
Morrow Jeffrey G and Fabbri Morrow Paula A
Purchase Details
Closed on
Aug 28, 1997
Sold by
Young Dale A and Young Lisanne
Bought by
Morrow Jeffrey G and Morrow Paula A Fabbri
Create a Home Valuation Report for This Property
The Home Valuation Report is an in-depth analysis detailing your home's value as well as a comparison with similar homes in the area
Home Values in the Area
Average Home Value in this Area
Purchase History
| Date | Buyer | Sale Price | Title Company |
|---|---|---|---|
| Fabbri Morrow Paula A | -- | Attorney | |
| Morrow Jeffrey G | -- | -- | |
| Morrow Jeffrey G | $205,000 | -- |
Source: Public Records
Tax History Compared to Growth
Tax History
| Year | Tax Paid | Tax Assessment Tax Assessment Total Assessment is a certain percentage of the fair market value that is determined by local assessors to be the total taxable value of land and additions on the property. | Land | Improvement |
|---|---|---|---|---|
| 2024 | $11,651 | $193,322 | $126,416 | $66,906 |
| 2023 | $10,853 | $178,770 | $116,900 | $61,870 |
| 2022 | $14,805 | $244,160 | $140,470 | $103,690 |
| 2021 | $14,452 | $238,090 | $136,980 | $101,110 |
| 2020 | $13,904 | $232,870 | $133,980 | $98,890 |
| 2019 | $13,638 | $221,400 | $127,380 | $94,020 |
| 2018 | $12,647 | $204,150 | $120,580 | $83,570 |
| 2017 | $12,395 | $194,540 | $114,900 | $79,640 |
| 2016 | $12,166 | $183,270 | $108,240 | $75,030 |
| 2015 | $12,084 | $170,740 | $100,840 | $69,900 |
| 2014 | $10,341 | $134,190 | $83,120 | $51,070 |
| 2013 | $10,222 | $136,080 | $84,290 | $51,790 |
Source: Public Records
Map
Nearby Homes
- 134 N Caroline Ave
- 130 S Elm Tree Ln
- 128 S Linden Ave
- 396 E Park Ave
- 110 N Pine St
- 444 E Schiller St
- 168 S Fairlane Ave
- 435 E Park Ave
- 199 S Linden Ave
- 454 E Park Ave
- 153 S Kenmore Ave
- 402 E Huntington Ln
- 240 N Willow Rd
- 333 E Huntington Ln
- 286 N Indiana St
- 145 S York St Unit 404
- 145 S York St Unit 322
- 260 E Grantley Ave
- 234 E Grantley Ave
- 219 E Saint Charles Rd
- 132 N Clinton Ave
- 120 N Clinton Ave
- 136 N Clinton Ave
- 114 N Clinton Ave
- 142 N Clinton Ave
- 133 N Clinton Ave
- 110 N Clinton Ave
- 144 N Clinton Ave
- 123 N Berteau Ave
- 129 N Clinton Ave
- 127 N Berteau Ave
- 125 N Clinton Ave
- 117 N Berteau Ave
- 131 N Berteau Ave
- 121 N Clinton Ave
- 137 N Clinton Ave
- 106 N Clinton Ave
- 148 N Clinton Ave
- 143 N Clinton Ave
- 117 N Clinton Ave