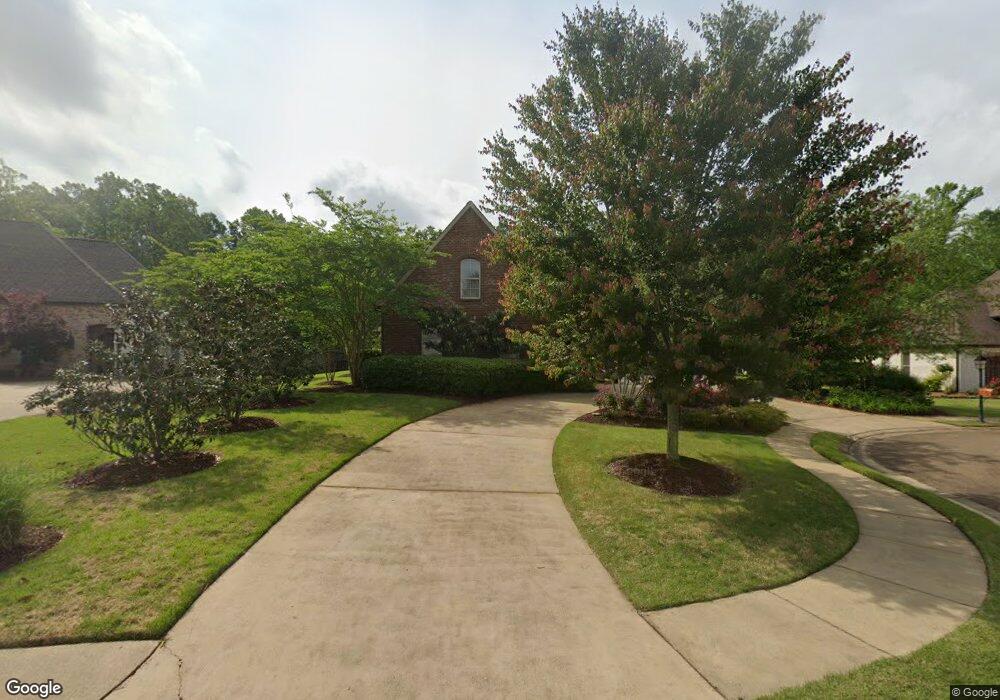
126 Pinnacle Cir Brandon, MS 39047
Estimated Value: $475,000 - $679,699
4
Beds
9
Baths
4,897
Sq Ft
$127/Sq Ft
Est. Value
About This Home
This home is located at 126 Pinnacle Cir, Brandon, MS 39047 and is currently estimated at $621,175, approximately $126 per square foot. 126 Pinnacle Cir is a home located in Rankin County with nearby schools including Northwest Rankin Elementary School, Northwest Rankin Middle School, and Northwest Rankin High School.
Ownership History
Date
Name
Owned For
Owner Type
Purchase Details
Closed on
Jul 22, 2024
Sold by
Lyles Wayne A and Lyles Sherry K
Bought by
Lyles Wayne A
Current Estimated Value
Purchase Details
Closed on
Apr 26, 2023
Sold by
Lyles Building Group Inc
Bought by
Ousby Darrell D and Ousby Monique
Purchase Details
Closed on
Sep 19, 2022
Sold by
Lyles Building Group Inc
Bought by
Dutta Roy Samragni and Dutta Abhishek Saha
Purchase Details
Closed on
Aug 29, 2022
Sold by
Lyles Building Group Inc
Bought by
Crews Michael J and Crews Jessica Rogers
Purchase Details
Closed on
Jul 15, 2022
Sold by
Lyles Buildng Group Inc
Bought by
Carter Patsy
Purchase Details
Closed on
Dec 17, 2021
Sold by
Lyles Building Group Inc
Bought by
Lyles Robert D and Lyles Constance M
Purchase Details
Closed on
Nov 19, 2021
Sold by
Lyles Building Group Inc
Bought by
Everett Steven H
Purchase Details
Closed on
Mar 30, 2021
Sold by
Lyles Building Group Inc
Bought by
Johnson Mario J and Johnson Yolanda Maria
Purchase Details
Closed on
Feb 19, 2021
Sold by
Lyles Building Group Inc
Bought by
Hughes Lauren K
Purchase Details
Closed on
Jan 21, 2020
Sold by
Lyles Building Group Inc
Bought by
Montegut Jeffrey and Montegut Geralyn
Purchase Details
Closed on
May 7, 2014
Bought by
Lyles Building Group Inc
Purchase Details
Closed on
Apr 17, 2014
Bought by
Lyles Building Group Inc
Create a Home Valuation Report for This Property
The Home Valuation Report is an in-depth analysis detailing your home's value as well as a comparison with similar homes in the area
Purchase History
| Date | Buyer | Sale Price | Title Company |
|---|---|---|---|
| Lyles Wayne A | -- | Title & Escrow Services Inc | |
| Ousby Darrell D | -- | Title & Escrow Services Inc | |
| Dutta Roy Samragni | -- | Title & Escrow Services Inc | |
| Crews Michael J | -- | None Listed On Document | |
| Carter Patsy | -- | Youngblood Frank M | |
| Lyles Robert D | -- | Title & Escrow Services Inc | |
| Everett Steven H | -- | Title & Escrow Services Inc | |
| Johnson Mario J | -- | None Listed On Document | |
| Hughes Lauren K | -- | Youngblood Frank M | |
| Montegut Jeffrey | -- | Youngblood Frank M | |
| Lyles Building Group Inc | -- | -- | |
| Lyles Building Group Inc | -- | -- |
Source: Public Records
Tax History
| Year | Tax Paid | Tax Assessment Tax Assessment Total Assessment is a certain percentage of the fair market value that is determined by local assessors to be the total taxable value of land and additions on the property. | Land | Improvement |
|---|---|---|---|---|
| 2025 | $5,330 | $49,587 | $0 | $0 |
| 2024 | $5,041 | $49,587 | $0 | $0 |
| 2023 | $3,898 | $49,271 | $0 | $0 |
| 2022 | $3,844 | $49,271 | $0 | $0 |
| 2021 | $3,844 | $49,271 | $0 | $0 |
| 2020 | $3,844 | $49,271 | $0 | $0 |
| 2019 | $3,944 | $43,692 | $0 | $0 |
| 2018 | $3,871 | $43,692 | $0 | $0 |
| 2017 | $3,871 | $43,692 | $0 | $0 |
| 2016 | $3,610 | $42,902 | $0 | $0 |
| 2015 | $3,610 | $42,902 | $0 | $0 |
| 2014 | $3,983 | $42,902 | $0 | $0 |
| 2013 | $3,983 | $42,902 | $0 | $0 |
Source: Public Records
Map
Nearby Homes
- 134 Pinnacle Cir
- 196 Woodlands Green Dr
- 132 Woodlands Glen Cir
- 214 Dominion Pkwy
- 512 Dixton Dr
- 340 Willow Ridge Cove
- 580 Hickory Place
- 303 Apple Blossom Ct
- 323 Woodlands Dr
- 180 Woodlands Cove
- 209 Pembroke Dr
- 423 Woodlands Cir
- 315 Woodlands Dr
- 502 Willow Court Dr
- 155 Dominion Pkwy
- 300 Cypress Creek Rd
- 308 Cypress Creek Rd
- 124 Dominion Pkwy
- 23 Carriage Court Place
- 890 Willow Grande Cir
- 128 Pinnacle Cir
- 124 Pinnacle Cir
- 127 Pinnacle Cir
- 130 Pinnacle Cir
- 122 Pinnacle Cir
- 125 Pinnacle Cir
- 123 Pinnacle Cir
- 121 Pinnacle Cir
- 132 Pinnacle Cir
- 120 Pinnacle Cir
- 119 Pinnacle Cir
- 118 Pinnacle Cir
- 129 Pinnacle Cir
- 303 Pinnacle Cove
- 303 Pinnacle Cove
- 302 Pinnacle Cove
- 117 Pinnacle Cir
- 116 Pinnacle Cir
- 136 Pinnacle Cir
- 300 Pinnacle Cove
Your Personal Tour Guide
Ask me questions while you tour the home.