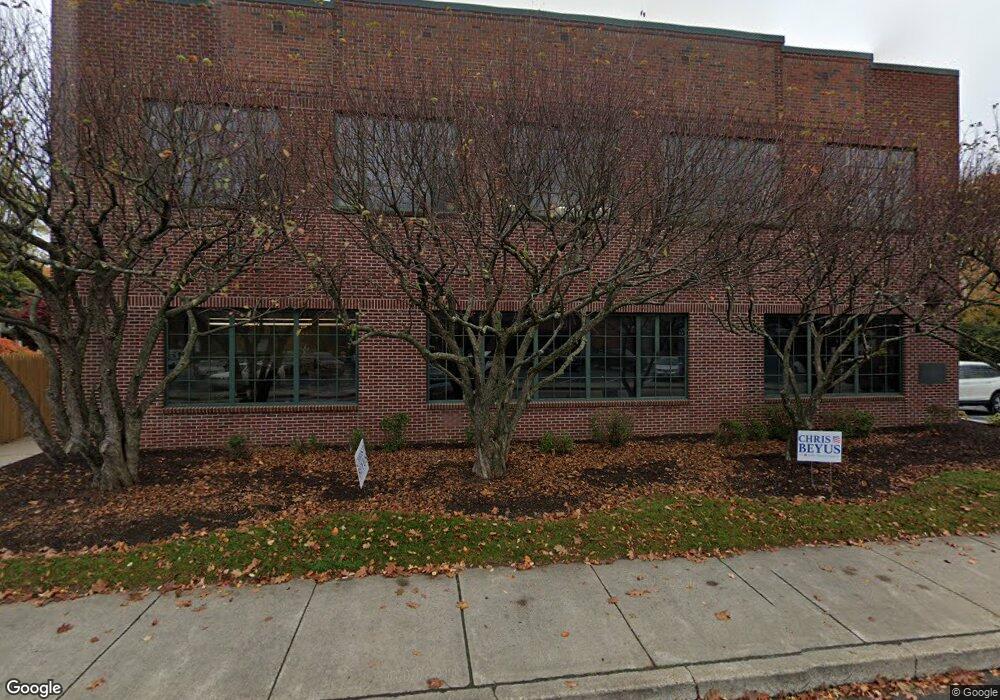
126 S Main St Torrington, CT 06790
Estimated Value: $1,231,131
--
Bed
--
Bath
19,608
Sq Ft
$63/Sq Ft
Est. Value
About This Home
This home is located at 126 S Main St, Torrington, CT 06790 and is currently estimated at $1,231,131, approximately $62 per square foot. 126 S Main St is a home located in Litchfield County with nearby schools including Torrington Middle School, Torrington High School, and Brooker Memorial CC & Learning Center.
Ownership History
Date
Name
Owned For
Owner Type
Purchase Details
Closed on
Jan 8, 2014
Sold by
Litchfield Insurance G
Bought by
126 South Main Street
Current Estimated Value
Home Financials for this Owner
Home Financials are based on the most recent Mortgage that was taken out on this home.
Original Mortgage
$500,000
Interest Rate
4.29%
Mortgage Type
Commercial
Purchase Details
Closed on
Dec 22, 1998
Sold by
N W Group Inc
Bought by
Litchfield Ind Grp Inc
Create a Home Valuation Report for This Property
The Home Valuation Report is an in-depth analysis detailing your home's value as well as a comparison with similar homes in the area
Home Values in the Area
Average Home Value in this Area
Purchase History
| Date | Buyer | Sale Price | Title Company |
|---|---|---|---|
| 126 South Main Street | $650,000 | -- | |
| Litchfield Ind Grp Inc | $1,000,000 | -- |
Source: Public Records
Mortgage History
| Date | Status | Borrower | Loan Amount |
|---|---|---|---|
| Closed | Litchfield Ind Grp Inc | $500,000 | |
| Previous Owner | Litchfield Ind Grp Inc | $500,000 |
Source: Public Records
Tax History Compared to Growth
Tax History
| Year | Tax Paid | Tax Assessment Tax Assessment Total Assessment is a certain percentage of the fair market value that is determined by local assessors to be the total taxable value of land and additions on the property. | Land | Improvement |
|---|---|---|---|---|
| 2025 | $39,145 | $1,018,080 | $47,600 | $970,480 |
| 2024 | $33,809 | $704,800 | $50,860 | $653,940 |
| 2023 | $33,802 | $704,800 | $50,860 | $653,940 |
| 2022 | $33,224 | $704,800 | $50,860 | $653,940 |
| 2021 | $32,541 | $704,800 | $50,860 | $653,940 |
| 2020 | $32,541 | $704,800 | $50,860 | $653,940 |
| 2019 | $20,148 | $436,390 | $48,650 | $387,740 |
| 2018 | $20,148 | $436,390 | $48,650 | $387,740 |
| 2017 | $19,965 | $436,390 | $48,650 | $387,740 |
| 2016 | $19,965 | $436,390 | $48,650 | $387,740 |
Source: Public Records
Map
Nearby Homes
- 271 S Main St
- 77 Marion Ave Unit 2
- 10 Irene St
- 184 Harwinton Ave
- 393 S Main St
- 53 Harwinton Ave Unit 4
- 149 Turner Ave
- 21 Roosevelt Ave
- 00 Church St
- 75 Maple St
- 30 Culvert St
- 21 Brookside Ave
- 25 George St
- 160 Laurel Hill Rd
- 291 E Main St
- 279 Main St
- 231 Beechwood Ave
- 118 Pearl St
- 121 Culvert St
- 333 Hillside Ave Unit 10