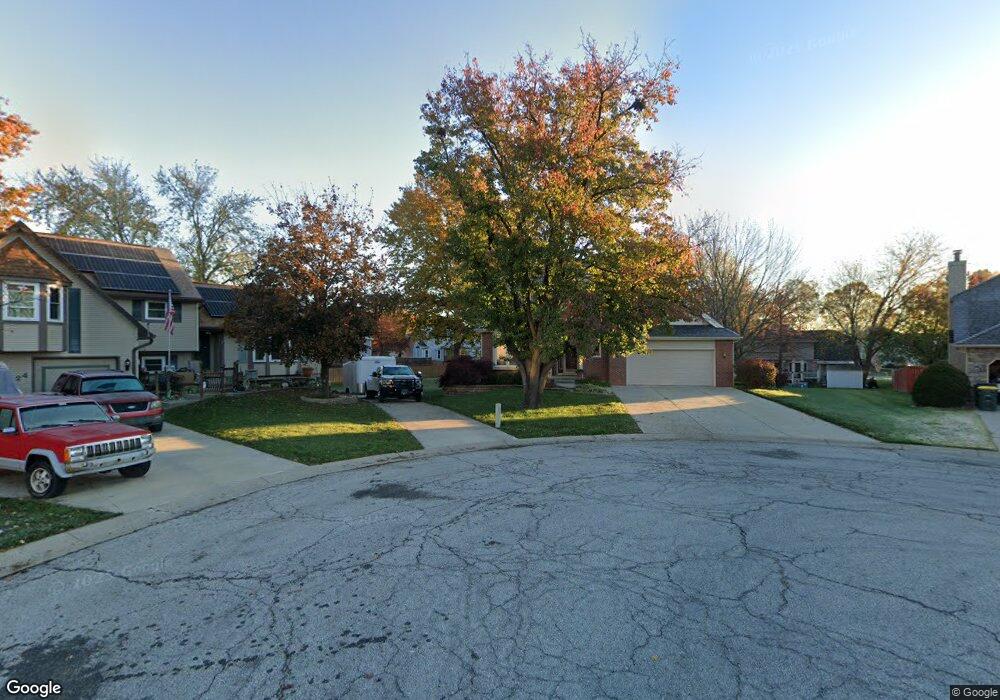
126 S Meadow Ct Lansing, KS 66043
Estimated Value: $339,000 - $413,000
4
Beds
4
Baths
2,503
Sq Ft
$154/Sq Ft
Est. Value
About This Home
This home is located at 126 S Meadow Ct, Lansing, KS 66043 and is currently estimated at $384,685, approximately $153 per square foot. 126 S Meadow Ct is a home located in Leavenworth County with nearby schools including Lansing Elementary School, Lansing Middle 6-8, and Lansing High 9-12.
Ownership History
Date
Name
Owned For
Owner Type
Purchase Details
Closed on
Jul 1, 1990
Bought by
Gray John C and Gray Laura L
Current Estimated Value
Home Financials for this Owner
Home Financials are based on the most recent Mortgage that was taken out on this home.
Original Mortgage
$110,000
Interest Rate
10.15%
Mortgage Type
New Conventional
Create a Home Valuation Report for This Property
The Home Valuation Report is an in-depth analysis detailing your home's value as well as a comparison with similar homes in the area
Home Values in the Area
Average Home Value in this Area
Purchase History
| Date | Buyer | Sale Price | Title Company |
|---|---|---|---|
| Gray John C | $132,000 | -- |
Source: Public Records
Mortgage History
| Date | Status | Borrower | Loan Amount |
|---|---|---|---|
| Closed | Gray John C | $110,000 | |
| Closed | Gray John C | $90,000 |
Source: Public Records
Tax History Compared to Growth
Tax History
| Year | Tax Paid | Tax Assessment Tax Assessment Total Assessment is a certain percentage of the fair market value that is determined by local assessors to be the total taxable value of land and additions on the property. | Land | Improvement |
|---|---|---|---|---|
| 2025 | $5,864 | $45,920 | $5,565 | $40,355 |
| 2024 | $5,864 | $45,920 | $4,415 | $41,505 |
| 2023 | $5,864 | $44,971 | $4,415 | $40,556 |
| 2022 | $5,495 | $40,882 | $3,444 | $37,438 |
| 2021 | $5,495 | $38,076 | $3,444 | $34,632 |
| 2020 | $5,089 | $34,718 | $3,444 | $31,274 |
| 2019 | $5,033 | $34,293 | $3,444 | $30,849 |
| 2018 | $4,749 | $32,388 | $2,865 | $29,523 |
| 2017 | $4,544 | $30,937 | $2,865 | $28,072 |
| 2016 | $4,234 | $28,834 | $2,865 | $25,969 |
| 2015 | $4,222 | $28,834 | $2,865 | $25,969 |
| 2014 | $4,094 | $28,549 | $2,865 | $25,684 |
Source: Public Records
Map
Nearby Homes
- 73 Continental Dr
- 77 Continental Dr
- 415 Fairlane St
- 512 Fairlane St
- 261 Holiday Dr
- 542 Creekside Ct
- 129 Brookwood St
- 319 Holiday Dr
- 124 S Main St
- 202 S Main St
- 268 Holiday Dr
- 527 S Valley Dr
- 624 S Bittersweet Ln
- 506 1st Terrace
- 1013 Sycamore Ridge Dr
- 209 E Kay St
- 722 Bittersweet Rd
- 218 E Kay St
- 000 4-H Rd
- 811 4-H Rd
- 124 S Meadow Ct
- 128 S Meadow Ct
- 121 S Brookridge St
- 117 S Brookridge St
- 615 Meadowlark Rd
- 619 Meadowlark Rd
- 125 S Brookridge St
- 208 S Meadow Ct
- 125 Brookridge St
- 131 S Meadow Ct
- 613 Meadowlark Rd
- 623 Meadowlark Rd
- 135 S Meadow Ct
- 203 S Brookridge St
- 139 S Meadow Ct
- 132 S Brookridge St
- 629 Meadowlark Rd
- 138 S Brookridge St
- 136 S Ethel Ln
- 134 S Ethel Ln