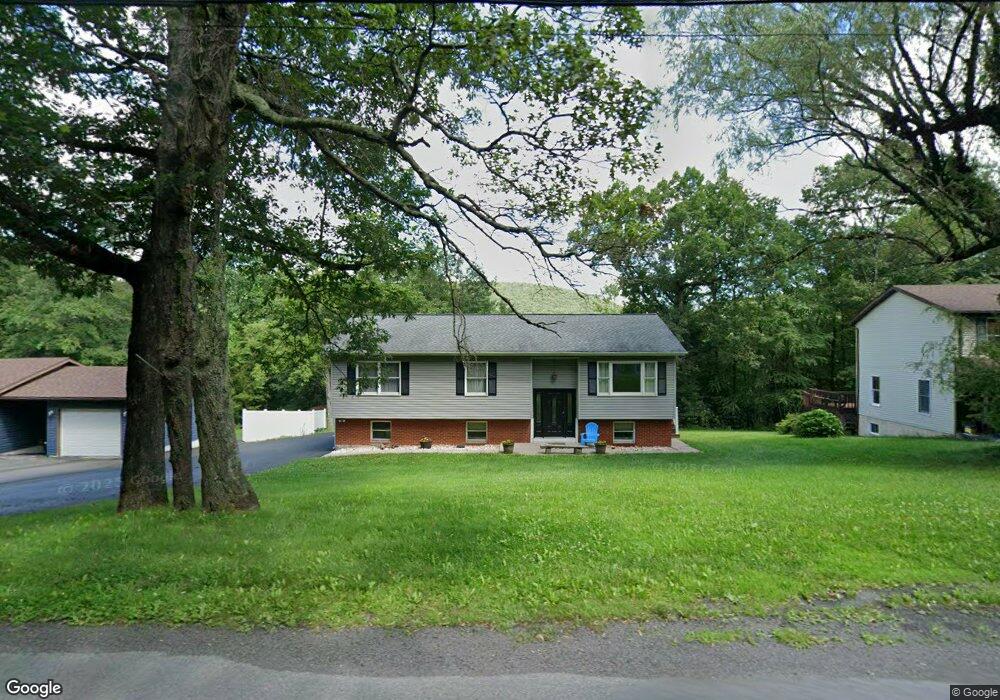
126 Stock St Nesquehoning, PA 18240
Estimated Value: $263,879 - $299,000
3
Beds
2
Baths
1,282
Sq Ft
$223/Sq Ft
Est. Value
About This Home
This home is located at 126 Stock St, Nesquehoning, PA 18240 and is currently estimated at $286,470, approximately $223 per square foot. 126 Stock St is a home located in Carbon County with nearby schools including Panther Valley Elementary School, Panther Valley Intermediate School, and Panther Valley Junior/Senior High School.
Ownership History
Date
Name
Owned For
Owner Type
Purchase Details
Closed on
Feb 17, 2010
Sold by
Jones Christopher M and Jones Jennifer L
Bought by
Jones Christopher M and Jones Jennifer L
Current Estimated Value
Home Financials for this Owner
Home Financials are based on the most recent Mortgage that was taken out on this home.
Original Mortgage
$131,377
Outstanding Balance
$87,901
Interest Rate
5.25%
Mortgage Type
FHA
Estimated Equity
$198,569
Purchase Details
Closed on
Mar 13, 2006
Sold by
Mcmichael William J
Bought by
Jones Christopher J and Jones Jennifer L
Home Financials for this Owner
Home Financials are based on the most recent Mortgage that was taken out on this home.
Original Mortgage
$104,000
Interest Rate
6.28%
Mortgage Type
New Conventional
Create a Home Valuation Report for This Property
The Home Valuation Report is an in-depth analysis detailing your home's value as well as a comparison with similar homes in the area
Home Values in the Area
Average Home Value in this Area
Purchase History
| Date | Buyer | Sale Price | Title Company |
|---|---|---|---|
| Jones Christopher M | -- | Transtar National Title | |
| Jones Christopher J | $130,000 | None Available |
Source: Public Records
Mortgage History
| Date | Status | Borrower | Loan Amount |
|---|---|---|---|
| Open | Jones Christopher M | $131,377 | |
| Closed | Jones Christopher J | $104,000 |
Source: Public Records
Tax History Compared to Growth
Tax History
| Year | Tax Paid | Tax Assessment Tax Assessment Total Assessment is a certain percentage of the fair market value that is determined by local assessors to be the total taxable value of land and additions on the property. | Land | Improvement |
|---|---|---|---|---|
| 2025 | $4,819 | $51,000 | $6,450 | $44,550 |
| 2024 | $5,016 | $51,000 | $6,450 | $44,550 |
| 2023 | $4,914 | $51,000 | $6,450 | $44,550 |
| 2022 | $4,946 | $51,000 | $6,450 | $44,550 |
| 2021 | $4,946 | $51,000 | $6,450 | $44,550 |
| 2020 | $4,870 | $51,000 | $6,450 | $44,550 |
| 2019 | $4,589 | $51,000 | $6,450 | $44,550 |
| 2018 | $4,538 | $51,000 | $6,450 | $44,550 |
| 2017 | $4,538 | $51,000 | $6,450 | $44,550 |
| 2016 | -- | $51,000 | $6,450 | $44,550 |
| 2015 | -- | $51,000 | $6,450 | $44,550 |
| 2014 | -- | $51,000 | $6,450 | $44,550 |
Source: Public Records
Map
Nearby Homes
- 0 11th Ave Unit PM-131093
- 16 Andrewsville St
- 237 Stock St
- 421 E Patterson St
- 308 E Snyder Ave
- 31 Powell St
- 231-233 E Ridge St
- 265-267 E Bertsch St
- 328 E Abbott St
- 307 E Abbott St
- 221 E Patterson St
- 312 E Abbott St
- 221 E Bertsch St
- 260 E Abbott St
- 138 E Fell St
- 333 E Hazard St
- 36 E Fell St
- 40 Springgarden St
- 9 Tunnel St
- 25 W Ridge St