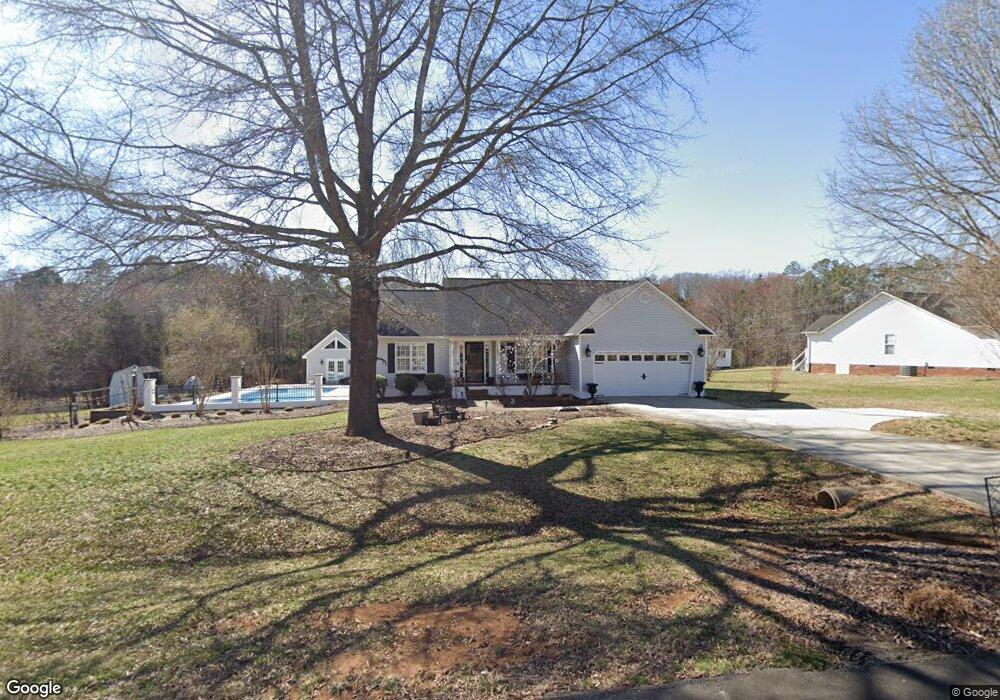
126 Timber Creek Rd Advance, NC 27006
Estimated Value: $313,725 - $357,000
3
Beds
2
Baths
1,226
Sq Ft
$268/Sq Ft
Est. Value
About This Home
This home is located at 126 Timber Creek Rd, Advance, NC 27006 and is currently estimated at $328,431, approximately $267 per square foot. 126 Timber Creek Rd is a home located in Davie County with nearby schools including Shady Grove Elementary School, William Ellis Middle School, and Davie County High School.
Ownership History
Date
Name
Owned For
Owner Type
Purchase Details
Closed on
Jan 22, 2020
Sold by
Johnson Eric Vaugh Est
Bought by
Pinnix Heather B
Current Estimated Value
Home Financials for this Owner
Home Financials are based on the most recent Mortgage that was taken out on this home.
Original Mortgage
$155,881
Outstanding Balance
$135,366
Interest Rate
2.75%
Mortgage Type
FHA
Estimated Equity
$193,065
Purchase Details
Closed on
Feb 16, 2017
Sold by
Johnson Eric Vaughn and Johnson Norma Jean
Bought by
Johnson Eric Vaughn
Purchase Details
Closed on
Apr 7, 2005
Sold by
Phelps Thomas E and Phelps Jean S
Bought by
Johnson Eric Vaughan and Johnson Norma Jean
Home Financials for this Owner
Home Financials are based on the most recent Mortgage that was taken out on this home.
Original Mortgage
$160,794
Interest Rate
5.62%
Mortgage Type
New Conventional
Purchase Details
Closed on
Jul 1, 1997
Purchase Details
Closed on
Apr 1, 1997
Create a Home Valuation Report for This Property
The Home Valuation Report is an in-depth analysis detailing your home's value as well as a comparison with similar homes in the area
Home Values in the Area
Average Home Value in this Area
Purchase History
| Date | Buyer | Sale Price | Title Company |
|---|---|---|---|
| Pinnix Heather B | -- | None Available | |
| Johnson Eric Vaughn | -- | None Available | |
| Johnson Eric Vaughan | $179,000 | -- | |
| -- | $129,000 | -- | |
| -- | -- | -- |
Source: Public Records
Mortgage History
| Date | Status | Borrower | Loan Amount |
|---|---|---|---|
| Open | Pinnix Heather B | $155,881 | |
| Previous Owner | Johnson Eric Vaughan | $160,794 |
Source: Public Records
Tax History Compared to Growth
Tax History
| Year | Tax Paid | Tax Assessment Tax Assessment Total Assessment is a certain percentage of the fair market value that is determined by local assessors to be the total taxable value of land and additions on the property. | Land | Improvement |
|---|---|---|---|---|
| 2025 | $2,206 | $320,350 | $62,000 | $258,350 |
| 2024 | $1,471 | $190,360 | $50,000 | $140,360 |
| 2023 | $1,471 | $190,360 | $50,000 | $140,360 |
| 2022 | $1,471 | $190,360 | $50,000 | $140,360 |
| 2021 | $1,471 | $190,360 | $50,000 | $140,360 |
| 2020 | $1,385 | $178,010 | $50,000 | $128,010 |
| 2019 | $1,385 | $178,010 | $50,000 | $128,010 |
| 2018 | $1,385 | $178,010 | $50,000 | $128,010 |
| 2017 | $1,367 | $178,010 | $0 | $0 |
| 2016 | $1,411 | $183,770 | $0 | $0 |
| 2015 | $1,411 | $183,770 | $0 | $0 |
| 2014 | $1,213 | $183,770 | $0 | $0 |
| 2013 | -- | $183,770 | $0 | $0 |
Source: Public Records
Map
Nearby Homes
- 131 Sawgrass Dr
- 183 Scottsdale Dr
- 00 Seay Dr
- 153 Caudle Meadows Dr
- 116 Arnold Palmer Dr
- 561 Oak Valley Blvd
- 585 Oak Valley Blvd
- 196 Arnold Palmer Dr
- 246 Broadmoor Dr
- 692 Oak Valley Blvd
- 433 Bingham and Parks Rd
- 135 Lonetree Cir
- 376 Kingsmill Dr
- Davidson Plan at Fiddler's Ridge
- Atherton Plan at Fiddler's Ridge
- Colfax Plan at Fiddler's Ridge
- Sullivan Plan at Fiddler's Ridge
- Avery Plan at Fiddler's Ridge
- Cooper Plan at Fiddler's Ridge
- 420 Bingham and Parks Rd
- 112 Timber Creek Rd
- 121 Timber Creek Rd
- 129 Timber Creek Rd
- 111 Timber Creek Rd
- 137 Timber Creek Rd
- 141 Timber Creek Rd
- 105 Timber Creek Rd
- 143 Timber Creek Rd
- 544 Gun Club Rd
- 490 Gun Club Rd
- 510 Gun Club Rd
- 1276 Beauchamp Rd
- 1356 Beauchamp Rd
- 1336 Beauchamp Rd
- 1246 Beauchamp Rd
- 1222 Beauchamp Rd
- 1259 Beauchamp Rd
- 1339 Beauchamp Rd
- 1245 Beauchamp Rd
- 1221 Beauchamp Rd