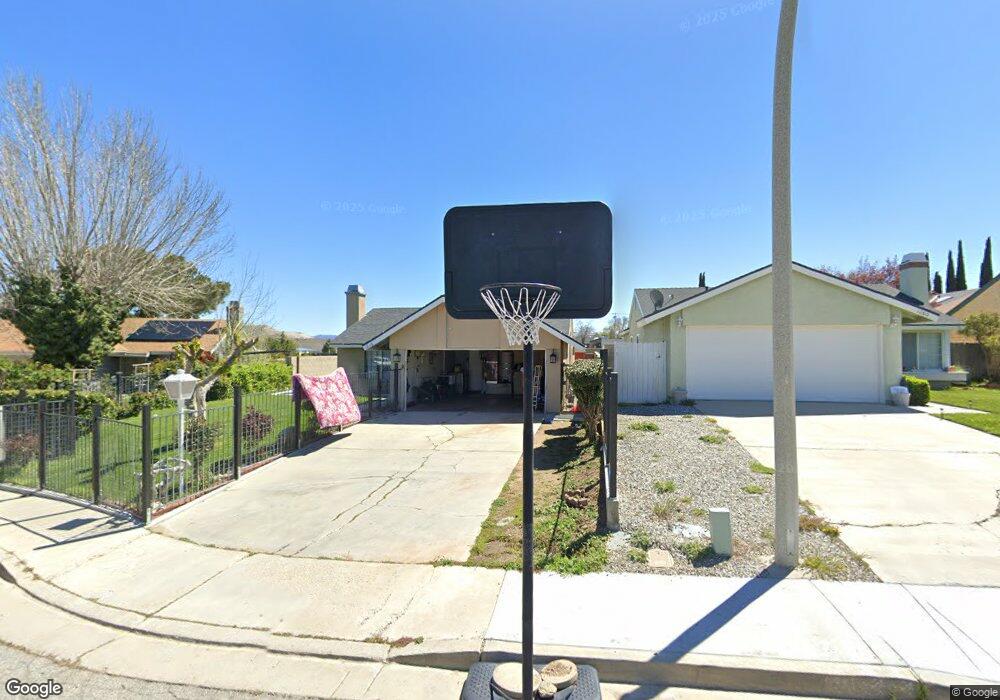
1260 Alder Ave Tehachapi, CA 93561
Estimated Value: $305,000 - $341,000
3
Beds
2
Baths
1,155
Sq Ft
$281/Sq Ft
Est. Value
About This Home
This home is located at 1260 Alder Ave, Tehachapi, CA 93561 and is currently estimated at $324,484, approximately $280 per square foot. 1260 Alder Ave is a home located in Kern County with nearby schools including Tompkins Elementary School, Jacobsen Middle School, and Tehachapi High School.
Ownership History
Date
Name
Owned For
Owner Type
Purchase Details
Closed on
Jan 14, 2010
Sold by
Embry Sherrie Lynn
Bought by
Embry Gail Ann
Current Estimated Value
Home Financials for this Owner
Home Financials are based on the most recent Mortgage that was taken out on this home.
Original Mortgage
$80,000
Outstanding Balance
$52,418
Interest Rate
4.91%
Mortgage Type
New Conventional
Estimated Equity
$272,066
Purchase Details
Closed on
May 6, 2005
Sold by
Embry Timothy Wade
Bought by
Embry Sherrie Lynn
Home Financials for this Owner
Home Financials are based on the most recent Mortgage that was taken out on this home.
Original Mortgage
$133,000
Interest Rate
7.4%
Mortgage Type
Purchase Money Mortgage
Purchase Details
Closed on
Feb 8, 2005
Sold by
Embry Timothy Wade and Embry Sherrie Lynn
Bought by
Embry Sherrie Lynn
Create a Home Valuation Report for This Property
The Home Valuation Report is an in-depth analysis detailing your home's value as well as a comparison with similar homes in the area
Home Values in the Area
Average Home Value in this Area
Purchase History
| Date | Buyer | Sale Price | Title Company |
|---|---|---|---|
| Embry Gail Ann | $115,000 | Chicago Title Company | |
| Embry Sherrie Lynn | -- | Ticor Title | |
| Embry Sherrie Lynn | -- | Ticor Title |
Source: Public Records
Mortgage History
| Date | Status | Borrower | Loan Amount |
|---|---|---|---|
| Open | Embry Gail Ann | $80,000 | |
| Previous Owner | Embry Sherrie Lynn | $133,000 |
Source: Public Records
Tax History
| Year | Tax Paid | Tax Assessment Tax Assessment Total Assessment is a certain percentage of the fair market value that is determined by local assessors to be the total taxable value of land and additions on the property. | Land | Improvement |
|---|---|---|---|---|
| 2025 | $1,871 | $148,430 | $51,627 | $96,803 |
| 2024 | $1,802 | $145,520 | $50,615 | $94,905 |
| 2023 | $1,802 | $142,668 | $49,623 | $93,045 |
| 2022 | $1,781 | $139,871 | $48,650 | $91,221 |
| 2021 | $1,737 | $137,130 | $47,697 | $89,433 |
| 2020 | $1,733 | $135,724 | $47,208 | $88,516 |
| 2019 | $1,732 | $135,724 | $47,208 | $88,516 |
| 2018 | $1,673 | $130,456 | $45,376 | $85,080 |
| 2017 | $1,671 | $127,899 | $44,487 | $83,412 |
| 2016 | $1,627 | $125,392 | $43,615 | $81,777 |
| 2015 | $1,550 | $123,509 | $42,960 | $80,549 |
| 2014 | $1,533 | $121,091 | $42,119 | $78,972 |
Source: Public Records
Map
Nearby Homes
- 210 Pinon St Unit 11
- 210 Pinon St Unit 18
- 210 Pinon St Unit 4
- 210 Pinon St Unit 1
- 210 Pinon St Unit 6
- 210 Pinon St Unit 15
- 210 Pinon St Unit 5
- 210 Pinon St Unit 9
- 210 Pinon St Unit 7
- 210 Pinon St Unit 13
- 210 Pinon St Unit 8
- 210 Pinon St Unit 3
- 210 Pinon St Unit 16
- 210 Pinon St Unit 19
- 210 Pinon St Unit 10
- 210 Pinon St Unit 12
- 210 Pinon St Unit 14
- 210 Pinon St Unit 17
- 1309 Clasico Dr
- 0 Pinon St
- 1264 Alder Ave
- 1256 Alder Ave
- 1268 Alder Ave
- 213 Meadowbrook Ct
- 1252 Alder Ave
- 211 Meadowbrook Ct
- 1233 Alder Ave
- 1269 Alder Ave
- 209 Meadowbrook Ct
- 1267 Alder Ave
- 1248 Alder Ave
- 1229 Alder Ave
- 1244 Alder Ave
- 1240 Alder Ave
- 207 Meadowbrook Ct
- 214 Meadowbrook Ct
- 216 Meadowbrook Ct
- 212 Meadowbrook Ct
- 305 Meadowbrook Ct
- 305 Meadowbrook Ct
Your Personal Tour Guide
Ask me questions while you tour the home.