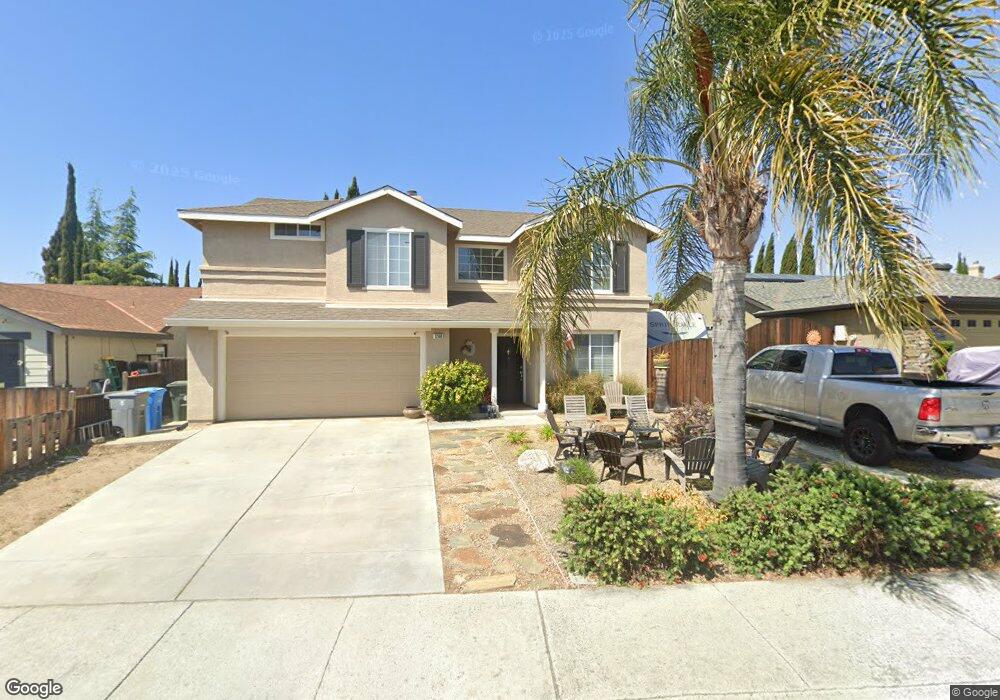
1260 Brighton Dr Hollister, CA 95023
Estimated Value: $756,936 - $802,000
3
Beds
3
Baths
2,117
Sq Ft
$367/Sq Ft
Est. Value
About This Home
This home is located at 1260 Brighton Dr, Hollister, CA 95023 and is currently estimated at $777,484, approximately $367 per square foot. 1260 Brighton Dr is a home located in San Benito County with nearby schools including Cerra Vista Elementary School, Rancho San Justo School, and San Benito High School.
Ownership History
Date
Name
Owned For
Owner Type
Purchase Details
Closed on
Aug 20, 2008
Sold by
Washington Mutual Bank
Bought by
Costa Leanne E and Costa George R
Current Estimated Value
Home Financials for this Owner
Home Financials are based on the most recent Mortgage that was taken out on this home.
Original Mortgage
$350,517
Interest Rate
6.51%
Mortgage Type
VA
Purchase Details
Closed on
May 20, 2008
Sold by
Lofton Angelika
Bought by
Washington Mutual Bank
Purchase Details
Closed on
May 24, 2004
Sold by
Cipolla Peter M and Cipolla Pamela L
Bought by
Lofton Angelika
Home Financials for this Owner
Home Financials are based on the most recent Mortgage that was taken out on this home.
Original Mortgage
$416,800
Interest Rate
6.25%
Mortgage Type
Purchase Money Mortgage
Create a Home Valuation Report for This Property
The Home Valuation Report is an in-depth analysis detailing your home's value as well as a comparison with similar homes in the area
Home Values in the Area
Average Home Value in this Area
Purchase History
| Date | Buyer | Sale Price | Title Company |
|---|---|---|---|
| Costa Leanne E | $343,500 | Servicelink | |
| Washington Mutual Bank | $315,000 | Accommodation | |
| Lofton Angelika | $521,000 | Chicago Title Co |
Source: Public Records
Mortgage History
| Date | Status | Borrower | Loan Amount |
|---|---|---|---|
| Previous Owner | Costa Leanne E | $350,517 | |
| Previous Owner | Lofton Angelika | $416,800 | |
| Closed | Lofton Angelika | $104,200 |
Source: Public Records
Tax History Compared to Growth
Tax History
| Year | Tax Paid | Tax Assessment Tax Assessment Total Assessment is a certain percentage of the fair market value that is determined by local assessors to be the total taxable value of land and additions on the property. | Land | Improvement |
|---|---|---|---|---|
| 2025 | $5,284 | $441,865 | $154,522 | $287,343 |
| 2023 | $5,284 | $424,709 | $148,523 | $276,186 |
| 2022 | $5,098 | $416,382 | $145,611 | $270,771 |
| 2021 | $5,027 | $408,218 | $142,756 | $265,462 |
| 2020 | $5,048 | $404,034 | $141,293 | $262,741 |
| 2019 | $4,902 | $396,113 | $138,523 | $257,590 |
| 2018 | $4,801 | $388,347 | $135,807 | $252,540 |
| 2017 | $4,735 | $380,734 | $133,145 | $247,589 |
| 2016 | $4,707 | $373,270 | $130,535 | $242,735 |
| 2015 | $4,663 | $367,664 | $128,575 | $239,089 |
| 2014 | $4,402 | $360,463 | $126,057 | $234,406 |
Source: Public Records
Map
Nearby Homes
- 2421 Valley View Rd
- 2360 Valley View Rd
- 2240 Preston Ct
- 2180 Clearview Dr
- 2102 White Oak Dr
- 1531 Brighton Dr
- 2260 Ventana Ct
- 2230 Ventana Ct
- 2711 Valley View Rd
- 2110 Glenview Dr
- 2171 White Oak Dr
- 2111 Marty Ln
- 2141 White Oak Dr
- 1600 Panorama Dr
- 1120 Richard Rd
- 1231 Westward Dr
- 1740 Brentwood Ct
- 1941 Memorial Dr
- 1871 Peony St
- 1770 Brentwood Ct
- 1270 Brighton Dr
- 1250 Brighton Dr
- 1241 Morningside Dr
- 1231 Morningside Dr
- 1280 Brighton Dr
- 1230 Brighton Dr
- 1249 Morningside Dr Unit 1
- 1227 Morningside Dr
- 1251 Brighton Dr
- 1231 Brighton Dr
- 1261 Brighton Dr
- 1271 Brighton Dr
- 1220 Brighton Dr
- 2320 Fairhaven Dr
- 1221 Morningside Dr
- 2300 Fairhaven Dr
- 1281 Brighton Dr
- 1201 Brighton Dr
- 2391 Valley View Rd Unit 1
- 1291 Brighton Dr