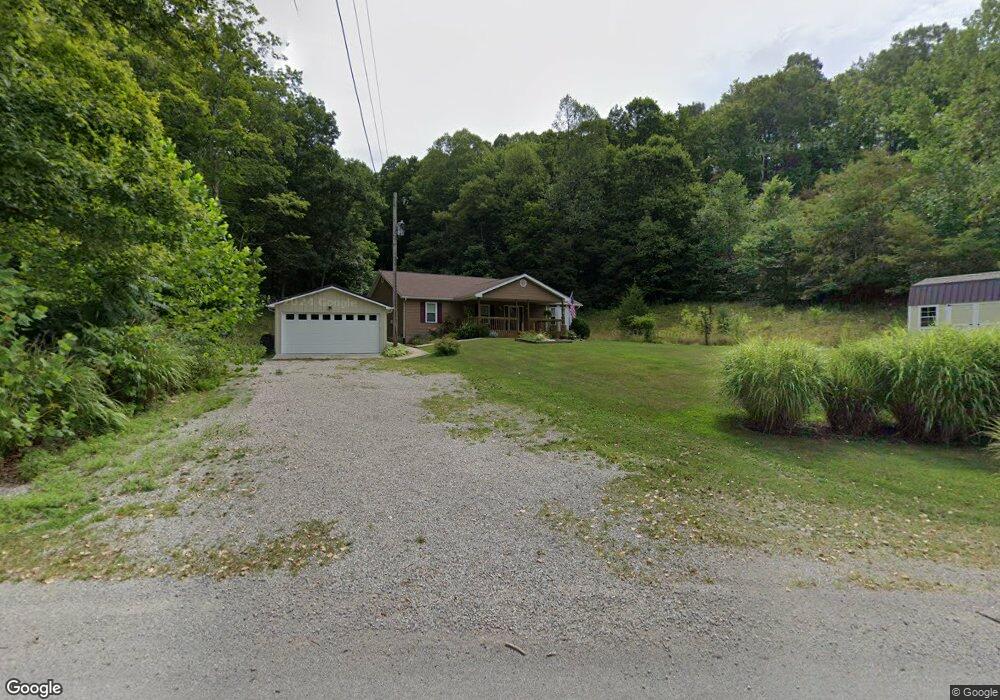
1260 Carr's Run Rd Waverly, OH 45690
Estimated Value: $153,000 - $344,163
4
Beds
2
Baths
2,138
Sq Ft
$132/Sq Ft
Est. Value
About This Home
This home is located at 1260 Carr's Run Rd, Waverly, OH 45690 and is currently estimated at $282,791, approximately $132 per square foot. 1260 Carr's Run Rd is a home located in Pike County.
Ownership History
Date
Name
Owned For
Owner Type
Purchase Details
Closed on
Nov 21, 2012
Sold by
Raynard Raymond M and Raynard Tammi L
Bought by
Fultz Jason P and Fultz Philip R
Current Estimated Value
Home Financials for this Owner
Home Financials are based on the most recent Mortgage that was taken out on this home.
Original Mortgage
$123,626
Outstanding Balance
$83,495
Interest Rate
3.37%
Mortgage Type
FHA
Estimated Equity
$199,296
Purchase Details
Closed on
May 25, 2007
Sold by
Essman Lewis and Essman Deborah
Bought by
Raynard Raymond M and Raynard Tammi L
Home Financials for this Owner
Home Financials are based on the most recent Mortgage that was taken out on this home.
Original Mortgage
$122,000
Interest Rate
6.22%
Mortgage Type
New Conventional
Purchase Details
Closed on
Feb 10, 2006
Sold by
Wells Fargo Bank Na
Bought by
Essman Lewis
Purchase Details
Closed on
Sep 28, 2005
Sold by
Chase Home Finance Llc
Bought by
Wells Fargo Bank Na
Create a Home Valuation Report for This Property
The Home Valuation Report is an in-depth analysis detailing your home's value as well as a comparison with similar homes in the area
Purchase History
| Date | Buyer | Sale Price | Title Company |
|---|---|---|---|
| Fultz Jason P | $1,175,000 | None Available | |
| Raynard Raymond M | $122,000 | None Available | |
| Essman Lewis | $55,000 | None Available | |
| Wells Fargo Bank Na | $93,500 | None Available |
Source: Public Records
Mortgage History
| Date | Status | Borrower | Loan Amount |
|---|---|---|---|
| Open | Fultz Jason P | $123,626 | |
| Previous Owner | Raynard Raymond M | $122,000 |
Source: Public Records
Tax History
| Year | Tax Paid | Tax Assessment Tax Assessment Total Assessment is a certain percentage of the fair market value that is determined by local assessors to be the total taxable value of land and additions on the property. | Land | Improvement |
|---|---|---|---|---|
| 2025 | $2,118 | $62,570 | $8,090 | $54,480 |
| 2024 | $2,118 | $62,570 | $8,090 | $54,480 |
| 2023 | $2,124 | $62,570 | $8,090 | $54,480 |
| 2022 | $2,032 | $58,320 | $7,940 | $50,380 |
| 2021 | $1,980 | $58,320 | $7,940 | $50,380 |
| 2020 | $1,995 | $58,320 | $7,940 | $50,380 |
| 2019 | $1,835 | $53,020 | $7,220 | $45,800 |
| 2018 | $1,550 | $53,020 | $7,220 | $45,800 |
| 2017 | $1,474 | $50,280 | $7,220 | $43,060 |
| 2016 | $1,288 | $37,020 | $3,920 | $33,100 |
| 2015 | $1,289 | $37,020 | $3,920 | $33,100 |
| 2014 | $1,311 | $37,020 | $3,920 | $33,100 |
| 2013 | $1,403 | $37,020 | $3,920 | $33,100 |
| 2012 | $1,445 | $37,020 | $3,920 | $33,100 |
Source: Public Records
Map
Nearby Homes
- 001 Ervin Hill Rd
- 01 Ervin Hill Rd
- 0 Straight Creek Rd
- 0 Carrs Run Rd
- 1040 Straight Creek Rd
- 4604 Straight Creek Rd
- 151 Meadow Run Rd
- 0 Swift Creek Rd
- 9459 State Route 335
- 2662 Adams Rd
- 7679 Ohio 335
- 3725 Beaver Creek Rd
- 338 Anderson Ln
- 0 E Side State Route 335
- 0 Dutch Hollow Rd
- 0 Carrs Run Unit 1868855
- 6269 Beaver Pike
- 105 W Lindsey Ct W
- 1283 Hay Hollow Rd
- 114 Birch St
- 1260 Carrs Run Rd Unit 195192
- 1255 Carr's Run Rd
- 1203 Carr's Run Rd
- 1884 Straight Creek Rd
- 1295 Carrs Run Rd
- 1331 Carrs Run Rd
- 1137 Carrs Run Rd
- 1136 Carrs Run Rd
- 1145 Carrs Run Rd
- 0 Rd Unit 222042059
- 1371 Carrs Run Rd
- 1119 Carrs Run Rd
- 1118 Carrs Run Rd
- 1095 Carrs Run Rd
- 1143 Carr's Run Rd
- 1143 Carrs Run Rd
- 0 Carr's Run Rd Unit 183717
- 1451 Carrs Run Rd Unit 226208
- 1067 Carrs Run Rd Unit L
- 1453 Carrs Run Rd
Your Personal Tour Guide
Ask me questions while you tour the home.