T
Seller's Agent in 2020
Taryn Lower
My Home Group Real Estate
Estimated Value: $707,000 - $751,218
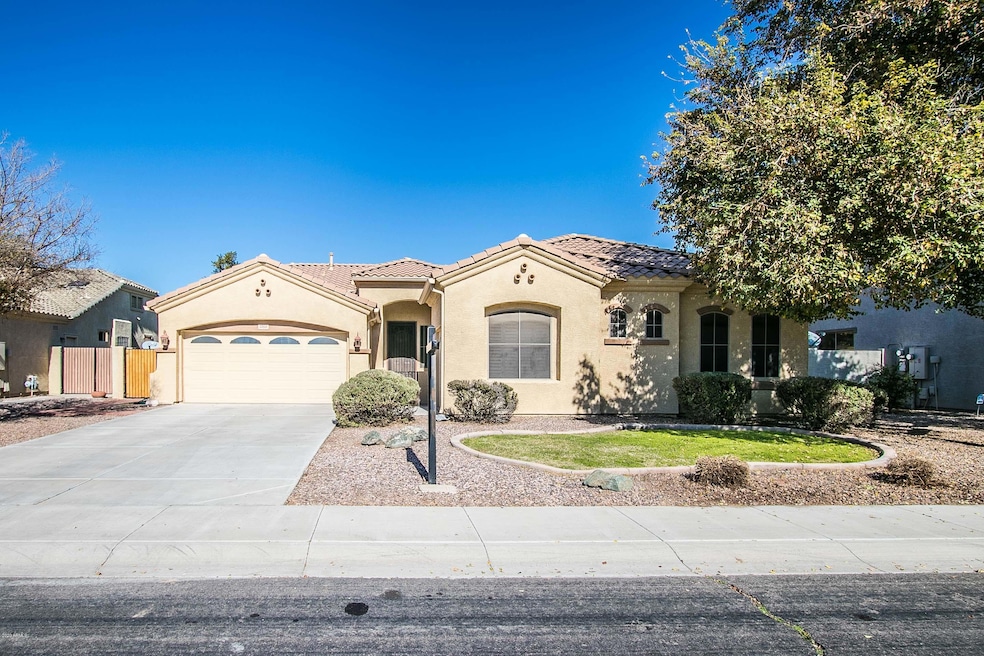
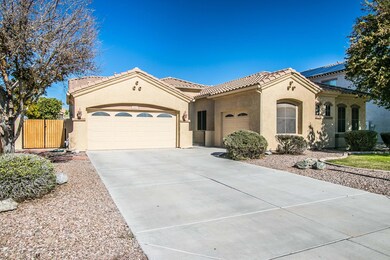
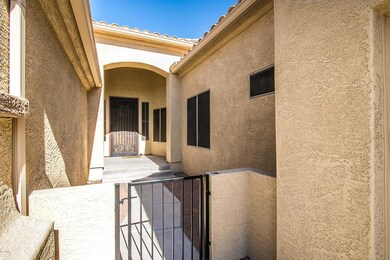
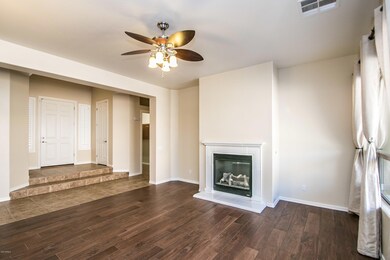
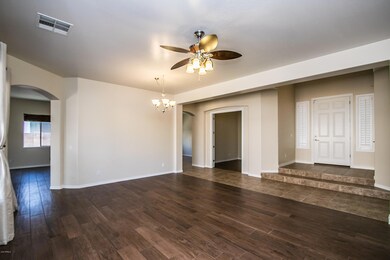
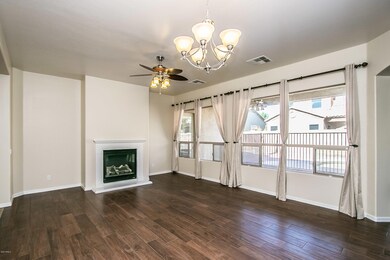
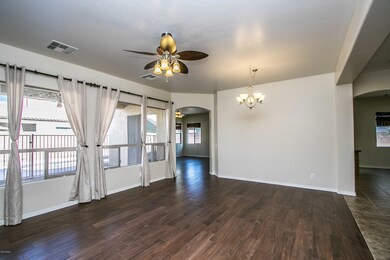
Highly upgraded single story home with a split floor plan. 10 feet ceilings, Gourmet kitchen with double ovens, gas cooktop, maple cabinets, and upgrade count-top. Beautiful gas fireplace in front room. Shutters throughout the home,and one of the extra bedrooms has a walk in closet. Spacious master bedroom with oversized walk-in closet. Office with double door can be 5th bedroom. This home is newly painted and Epoxy flooring in the garage. Great neighborhood with walking trails and parks. Close to San Tan mall and san tan freeway. Large covered patio, private pool with fountain.
Last Agent to Sell the Property
Taryn Lower
My Home Group Real Estate License #SA680564000 Listed on: 01/28/2020

We collect this data history from publicly available records. To have your information removed, we recommend requesting removal directly through your county’s website.
We collect this data history from publicly available records. To have your information removed, we recommend requesting removal directly through your county’s website.
| Date | Buyer | Sale Price | Title Company |
|---|---|---|---|
| -- | None Available | ||
| $450,000 | Magnus Title Agency | ||
| -- | Magnus Title Agency | ||
| $339,800 | Chicago Title Agency Inc | ||
| -- | Grand Canyon Title Agency In | ||
| $322,217 | First American Title Ins Co | ||
| -- | First American Title Ins Co |
We collect this data history from publicly available records. To have your information removed, we recommend requesting removal directly through your county’s website.
| Date | Status | Borrower | Loan Amount |
|---|---|---|---|
| Open | $225,000 | ||
| Open | $400,694 | ||
| Closed | $405,000 | ||
| Previous Owner | $254,850 | ||
| Previous Owner | $241,000 | ||
| Previous Owner | $247,500 | ||
| Previous Owner | $257,700 | ||
| Previous Owner | $257,700 |
We collect this data history from publicly available records. To have your information removed, we recommend requesting removal directly through your county’s website.
| Date | Event | Price | List to Sale | Price per Sq Ft | Prior Sale |
|---|---|---|---|---|---|
| 02/28/2020 02/28/20 | Sold | $450,000 | -2.0% | $157 / Sq Ft | |
| 01/28/2020 01/28/20 | For Sale | $459,000 | +35.1% | $160 / Sq Ft | |
| 07/12/2017 07/12/17 | Sold | $339,800 | -5.3% | $119 / Sq Ft | View Prior Sale |
| 06/04/2017 06/04/17 | For Sale | $359,000 | +5.7% | $126 / Sq Ft | |
| 06/01/2017 06/01/17 | Off Market | $339,800 | -- | -- | |
| 05/31/2017 05/31/17 | Pending | -- | -- | -- | |
| 05/16/2017 05/16/17 | For Sale | $359,000 | 0.0% | $126 / Sq Ft | |
| 03/01/2016 03/01/16 | Rented | $1,895 | 0.0% | -- | |
| 02/06/2016 02/06/16 | Under Contract | -- | -- | -- | |
| 02/04/2016 02/04/16 | Off Market | $1,895 | -- | -- | |
| 01/28/2016 01/28/16 | Price Changed | $1,895 | -2.8% | $1 / Sq Ft | |
| 01/19/2016 01/19/16 | For Rent | $1,950 | 0.0% | -- | |
| 01/18/2016 01/18/16 | Off Market | $1,950 | -- | -- | |
| 01/13/2016 01/13/16 | For Rent | $1,950 | 0.0% | -- | |
| 01/06/2016 01/06/16 | Off Market | $1,950 | -- | -- | |
| 01/03/2016 01/03/16 | For Rent | $1,950 | 0.0% | -- | |
| 12/30/2015 12/30/15 | Off Market | $1,950 | -- | -- | |
| 11/19/2015 11/19/15 | For Rent | $1,950 | +0.3% | -- | |
| 10/27/2014 10/27/14 | Rented | $1,945 | -7.2% | -- | |
| 09/25/2014 09/25/14 | Under Contract | -- | -- | -- | |
| 08/11/2014 08/11/14 | For Rent | $2,095 | +5.0% | -- | |
| 10/25/2013 10/25/13 | Rented | $1,995 | -2.7% | -- | |
| 10/12/2013 10/12/13 | Under Contract | -- | -- | -- | |
| 09/06/2013 09/06/13 | For Rent | $2,050 | -- | -- |
We collect this data history from publicly available records. To have your information removed, we recommend requesting removal directly through your county’s website.
| Year | Tax Paid | Tax Assessment Tax Assessment Total Assessment is a certain percentage of the fair market value that is determined by local assessors to be the total taxable value of land and additions on the property. | Land | Improvement |
|---|---|---|---|---|
| 2025 | $2,972 | $37,195 | ||
| 2024 | $3,399 | $30,500 | ||
| 2023 | $3,399 | $50,960 | $10,190 | $40,770 |
| 2022 | $2,743 | $39,880 | $7,970 | $31,910 |
| 2021 | $2,863 | $38,280 | $7,650 | $30,630 |
| 2020 | $2,850 | $35,660 | $7,130 | $28,530 |
| 2019 | $2,740 | $32,450 | $6,490 | $25,960 |
| 2018 | $3,145 | $30,730 | $6,140 | $24,590 |
| 2017 | $2,970 | $29,330 | $5,860 | $23,470 |
| 2016 | $2,820 | $28,770 | $5,750 | $23,020 |
| 2015 | $2,749 | $27,450 | $5,490 | $21,960 |
T
Seller's Agent in 2020
Taryn Lower
My Home Group Real Estate
C
Seller Co-Listing Agent in 2020
Cindy Valdez
HomeSmart
(480) 980-2318
1 in this area
75 Total Sales
Buyer's Agent in 2020
Rob Miele
HomeSmart
(602) 790-7070
88 Total Sales
J
Seller's Agent in 2017
Jenny Jie Sun Mou
Gold Trust Realty
(480) 593-3322
38 Total Sales
J
Buyer's Agent in 2017
Joe Yu
DPR Realty
(480) 226-2498
12 Total Sales
Buyer's Agent in 2016
Elizabeth Andari
Realty One Group
(602) 814-7908
21 Total Sales
Source: Arizona Regional Multiple Listing Service (ARMLS)
MLS Number: 6029423
APN: 304-57-658
Disclaimer: Certain information contained herein is derived from information provided by parties other than Homes.com. All information provided is deemed reliable, but is not guaranteed to be accurate and should be independently verified.
![]() All information should be verified by the recipient and none is guaranteed as accurate by ARMLS
All information should be verified by the recipient and none is guaranteed as accurate by ARMLS
Listing Information presented by local MLS brokerage: Ten-X, local REALTOR®- Arlene Richardson - (888)-952-6393
Ask me questions while you tour the home.