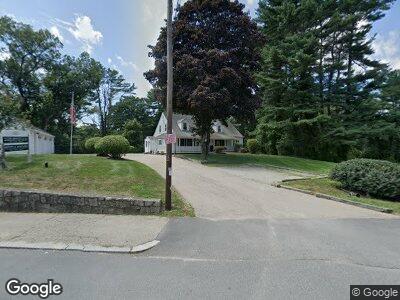
1260 Main St Coventry, RI 02816
4
Beds
3
Baths
2,810
Sq Ft
0.91
Acres
About This Home
This home is located at 1260 Main St, Coventry, RI 02816. 1260 Main St is a home located in Kent County with nearby schools including Alan Shawn Feinstein Ms Of Cov, Coventry High School, and Father John V. Doyle School.
Ownership History
Date
Name
Owned For
Owner Type
Purchase Details
Closed on
Aug 14, 2008
Sold by
Washington Mutual Bk
Bought by
Moffitt Victor G and Quakenbush Mary E
Purchase Details
Closed on
Jan 18, 2002
Sold by
Phillips Linda C
Bought by
Brodeur Michael A and Brodeur Kaylen J
Purchase Details
Closed on
Jan 20, 2000
Sold by
Green Lace Works Inc
Bought by
Phillips Linda C
Create a Home Valuation Report for This Property
The Home Valuation Report is an in-depth analysis detailing your home's value as well as a comparison with similar homes in the area
Home Values in the Area
Average Home Value in this Area
Purchase History
| Date | Buyer | Sale Price | Title Company |
|---|---|---|---|
| Moffitt Victor G | $299,000 | -- | |
| Washington Mutual Bk | $241,000 | -- | |
| Moffitt Victor G | $299,000 | -- | |
| Brodeur Michael A | $210,000 | -- | |
| Brodeur Michael A | $210,000 | -- | |
| Phillips Linda C | $55,000 | -- | |
| Phillips Linda C | $55,000 | -- |
Source: Public Records
Mortgage History
| Date | Status | Borrower | Loan Amount |
|---|---|---|---|
| Open | Phillips Linda C | $150,000 | |
| Previous Owner | Phillips Linda C | $400,000 |
Source: Public Records
Tax History Compared to Growth
Tax History
| Year | Tax Paid | Tax Assessment Tax Assessment Total Assessment is a certain percentage of the fair market value that is determined by local assessors to be the total taxable value of land and additions on the property. | Land | Improvement |
|---|---|---|---|---|
| 2024 | $10,329 | $464,000 | $232,300 | $231,700 |
| 2023 | $9,999 | $464,000 | $232,300 | $231,700 |
| 2022 | $9,750 | $413,300 | $193,600 | $219,700 |
| 2021 | $9,667 | $413,300 | $193,600 | $219,700 |
| 2020 | $11,081 | $413,300 | $193,600 | $219,700 |
| 2019 | $10,091 | $376,400 | $162,800 | $213,600 |
| 2018 | $9,805 | $376,400 | $162,800 | $213,600 |
| 2017 | $9,519 | $376,400 | $162,800 | $213,600 |
| 2016 | $9,105 | $370,400 | $143,600 | $226,800 |
| 2015 | $9,105 | $370,400 | $143,600 | $226,800 |
| 2014 | $9,105 | $370,400 | $143,600 | $226,800 |
| 2013 | -- | $398,200 | $161,200 | $237,000 |
Source: Public Records
Map
Nearby Homes
- 9 Jurczyk Ct
- 1205 Main St
- 17 Jurczyk Ct
- 1415 Main St
- 61 Abbotts Crossing Rd
- 4 Lisa's Way
- 45 Mashie Cir
- 2 Francis St
- 10 Stone St
- 20 Battey Ave
- 12 Tero Dr
- 18 Torch Ln
- 11 Torch Ln
- 16 Lear Dr Unit lea016
- 7 Giovanni Rose Ct
- 8 King Philip Rd Unit kin008
- 65 Wright Way
- 46 Wright Way
- 2 Milton Ln
- 49 Wright Way