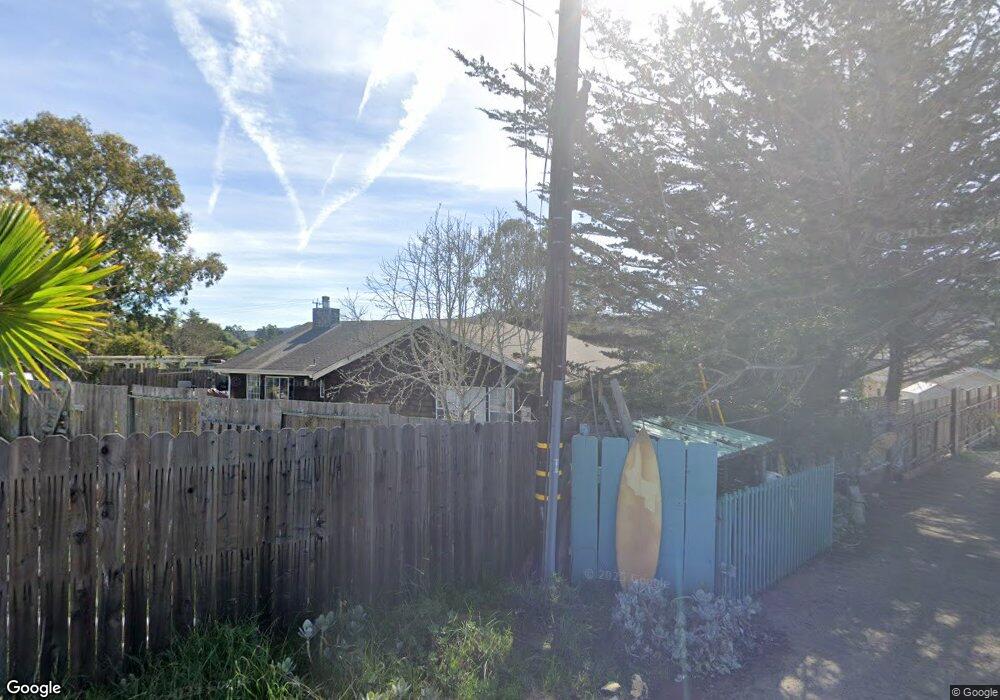
1260 Nipomo Ave Los Osos, CA 93402
Estimated Value: $1,057,000 - $1,430,000
4
Beds
2
Baths
2,300
Sq Ft
$508/Sq Ft
Est. Value
About This Home
This home is located at 1260 Nipomo Ave, Los Osos, CA 93402 and is currently estimated at $1,169,451, approximately $508 per square foot. 1260 Nipomo Ave is a home located in San Luis Obispo County with nearby schools including Baywood Elementary School, Los Osos Middle School, and Morro Bay High School.
Ownership History
Date
Name
Owned For
Owner Type
Purchase Details
Closed on
Nov 29, 2018
Sold by
Mccune Donald A and Mccune Lidia M
Bought by
Mccune Lidia M
Current Estimated Value
Purchase Details
Closed on
Mar 31, 2012
Sold by
Mccune Donald A and Mccune Lidia M
Bought by
Mccune Donald A and Mccune Lidia M
Home Financials for this Owner
Home Financials are based on the most recent Mortgage that was taken out on this home.
Original Mortgage
$250,000
Interest Rate
3.63%
Mortgage Type
New Conventional
Purchase Details
Closed on
Feb 2, 2010
Sold by
Mccune Donald and Mccune Lidia
Bought by
Mccune Donald A and Mccune Lidia M
Home Financials for this Owner
Home Financials are based on the most recent Mortgage that was taken out on this home.
Original Mortgage
$140,000
Interest Rate
5.03%
Mortgage Type
New Conventional
Purchase Details
Closed on
Mar 18, 2003
Sold by
Mccune Donald A and Mccune Lidia M
Bought by
Mccune Donald A and Mccune Lidia M
Home Financials for this Owner
Home Financials are based on the most recent Mortgage that was taken out on this home.
Original Mortgage
$172,000
Interest Rate
5.78%
Purchase Details
Closed on
Jul 25, 2002
Sold by
Mccune Donald A and Mccune Lidia M
Bought by
Mccune Donald A and Mccune Lidia M
Home Financials for this Owner
Home Financials are based on the most recent Mortgage that was taken out on this home.
Original Mortgage
$172,500
Interest Rate
6.6%
Mortgage Type
Purchase Money Mortgage
Purchase Details
Closed on
Feb 13, 2001
Sold by
Mccune Donald A and Mccune Lidia M
Bought by
Mccune Donald A and Mccune Lidia M
Purchase Details
Closed on
Nov 1, 1996
Sold by
Wolter Stephen A and Jamieson Lynn M
Bought by
Mccune Donald A and Mccune Lidia M
Create a Home Valuation Report for This Property
The Home Valuation Report is an in-depth analysis detailing your home's value as well as a comparison with similar homes in the area
Home Values in the Area
Average Home Value in this Area
Purchase History
| Date | Buyer | Sale Price | Title Company |
|---|---|---|---|
| Mccune Lidia M | -- | None Available | |
| Mccune Donald A | -- | First American Title Company | |
| Mccune Donald A | -- | First American Title Company | |
| Mccune Donald A | -- | First American Title Company | |
| Mccune Donald | -- | First American Title Company | |
| Mccune Donald A | -- | Chicago Title Company | |
| Mccune Donald A | -- | Chicago Title Company | |
| Mccune Donald A | -- | Chicago Title Co | |
| Mccune Donald A | -- | Chicago Title Co | |
| Mccune Donald A | -- | Chicago Title Co | |
| Mccune Donald A | -- | -- | |
| Mccune Donald A | -- | -- |
Source: Public Records
Mortgage History
| Date | Status | Borrower | Loan Amount |
|---|---|---|---|
| Previous Owner | Mccune Donald A | $250,000 | |
| Previous Owner | Mccune Donald | $140,000 | |
| Previous Owner | Mccune Donald A | $172,000 | |
| Previous Owner | Mccune Donald A | $172,500 |
Source: Public Records
Tax History Compared to Growth
Tax History
| Year | Tax Paid | Tax Assessment Tax Assessment Total Assessment is a certain percentage of the fair market value that is determined by local assessors to be the total taxable value of land and additions on the property. | Land | Improvement |
|---|---|---|---|---|
| 2025 | $7,473 | $401,926 | $138,421 | $263,505 |
| 2024 | $7,437 | $394,046 | $135,707 | $258,339 |
| 2023 | $7,437 | $386,321 | $133,047 | $253,274 |
| 2022 | $7,107 | $378,747 | $130,439 | $248,308 |
| 2021 | $6,905 | $371,322 | $127,882 | $243,440 |
| 2020 | $6,605 | $367,515 | $126,571 | $240,944 |
| 2019 | $6,062 | $360,310 | $124,090 | $236,220 |
| 2018 | $6,208 | $353,246 | $121,657 | $231,589 |
| 2017 | $5,848 | $346,321 | $119,272 | $227,049 |
| 2016 | $4,380 | $339,532 | $116,934 | $222,598 |
| 2015 | $4,323 | $334,433 | $115,178 | $219,255 |
| 2014 | $4,031 | $327,883 | $112,922 | $214,961 |
Source: Public Records
Map
Nearby Homes