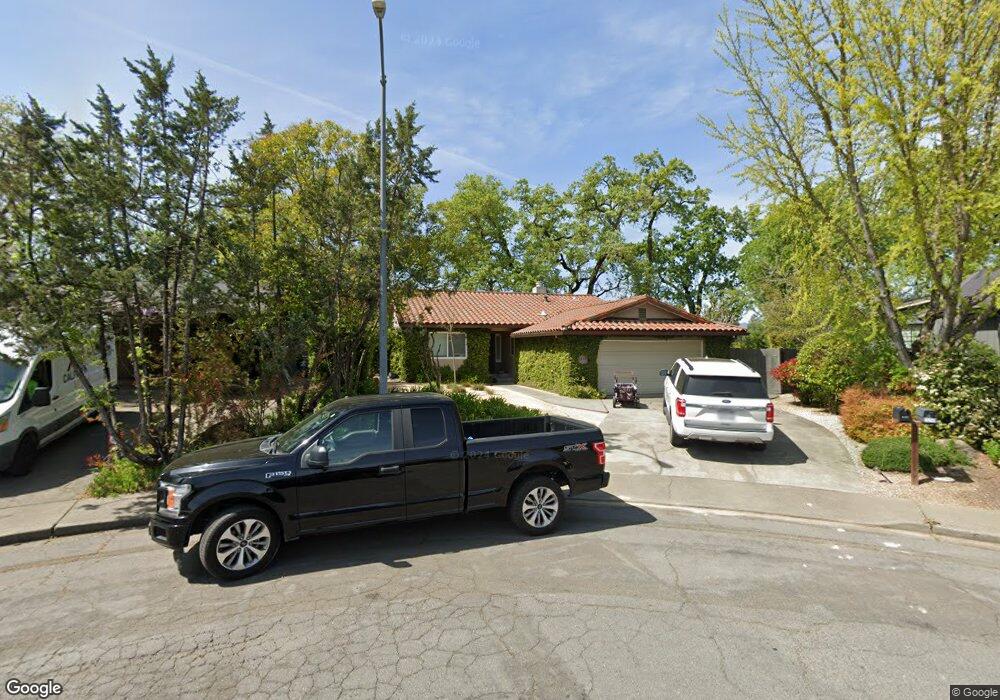
1260 Spring Brook Ct Saint Helena, CA 94574
Estimated Value: $1,220,613 - $1,818,000
3
Beds
2
Baths
1,457
Sq Ft
$1,103/Sq Ft
Est. Value
About This Home
This home is located at 1260 Spring Brook Ct, Saint Helena, CA 94574 and is currently estimated at $1,606,653, approximately $1,102 per square foot. 1260 Spring Brook Ct is a home located in Napa County with nearby schools including Saint Helena Primary School, Saint Helena Elementary School, and Robert Louis Stevenson Intermediate School.
Ownership History
Date
Name
Owned For
Owner Type
Purchase Details
Closed on
Jun 20, 2000
Sold by
Emmolo Cheryl A
Bought by
Emmolo Cheryl Ann and Cheryl Ann Emmolo 1999 Trust
Current Estimated Value
Purchase Details
Closed on
Apr 18, 2000
Sold by
Hyde Sharon A and Hyde Sharon A
Bought by
Emmolo Cheryl A
Home Financials for this Owner
Home Financials are based on the most recent Mortgage that was taken out on this home.
Original Mortgage
$359,600
Outstanding Balance
$105,650
Interest Rate
6.25%
Estimated Equity
$1,501,003
Purchase Details
Closed on
Aug 31, 1993
Sold by
Hyde Jerald R
Bought by
Hyde Sharon A Whitney
Home Financials for this Owner
Home Financials are based on the most recent Mortgage that was taken out on this home.
Original Mortgage
$90,000
Interest Rate
7.28%
Create a Home Valuation Report for This Property
The Home Valuation Report is an in-depth analysis detailing your home's value as well as a comparison with similar homes in the area
Home Values in the Area
Average Home Value in this Area
Purchase History
| Date | Buyer | Sale Price | Title Company |
|---|---|---|---|
| Emmolo Cheryl Ann | -- | -- | |
| Emmolo Cheryl A | $449,500 | First American Title Co | |
| Hyde Sharon A Whitney | -- | First American Title |
Source: Public Records
Mortgage History
| Date | Status | Borrower | Loan Amount |
|---|---|---|---|
| Open | Emmolo Cheryl A | $359,600 | |
| Previous Owner | Hyde Sharon A Whitney | $90,000 |
Source: Public Records
Tax History Compared to Growth
Tax History
| Year | Tax Paid | Tax Assessment Tax Assessment Total Assessment is a certain percentage of the fair market value that is determined by local assessors to be the total taxable value of land and additions on the property. | Land | Improvement |
|---|---|---|---|---|
| 2025 | $7,184 | $690,854 | $448,021 | $242,833 |
| 2024 | $7,184 | $677,309 | $439,237 | $238,072 |
| 2023 | $7,184 | $664,029 | $430,625 | $233,404 |
| 2022 | $6,822 | $651,010 | $422,182 | $228,828 |
| 2021 | $6,730 | $638,246 | $413,904 | $224,342 |
| 2020 | $6,661 | $631,702 | $409,660 | $222,042 |
| 2019 | $6,544 | $619,317 | $401,628 | $217,689 |
| 2018 | $6,437 | $607,174 | $393,753 | $213,421 |
| 2017 | $6,315 | $595,270 | $386,033 | $209,237 |
| 2016 | $6,171 | $583,599 | $378,464 | $205,135 |
| 2015 | $6,123 | $574,834 | $372,780 | $202,054 |
| 2014 | $6,063 | $563,575 | $365,478 | $198,097 |
Source: Public Records
Map
Nearby Homes
- 1291 Sylvaner Ave
- 0 Spring St
- 1191 Hudson Ave
- 1005 Valley View St
- 1149 Hudson Ave
- 2040 Olive Ave
- 2060 Olive Ave
- 1777 Adams St
- 1590 Sylvaner Ave
- 1711 Spring St
- 1881 Madrona Ave
- 1711 Tainter St
- 1664 Spring St
- 1243 Stockton St
- 1209 Stockton St
- 1540 Allyn Ave
- 1551 Spring St
- 1430 Stockton St
- 1707 Scott St
- 1430 Wallis Ct
- 1250 Spring Brook Ct
- 1261 Spring Brook Ct
- 1251 Spring Brook Ct
- 1241 Spring Brook Ct
- 1230 Spring Brook Ct
- 1231 Spring Brook Ct
- 1308 Sylvaner Ave
- 1290 Sylvaner Ave
- 1326 Sylvaner Ave
- 1220 Spring Brook Ct
- 1272 Sylvaner Ave
- 1221 Spring Brook Ct
- 1330 Sylvaner Ave
- 1210 Spring Brook Ct
- 1211 Spring Brook Ct
- 1236 Sylvaner Ave
- 1346 Sylvaner Ave
- 2080 Spring St
- 1317 Sylvaner Ave