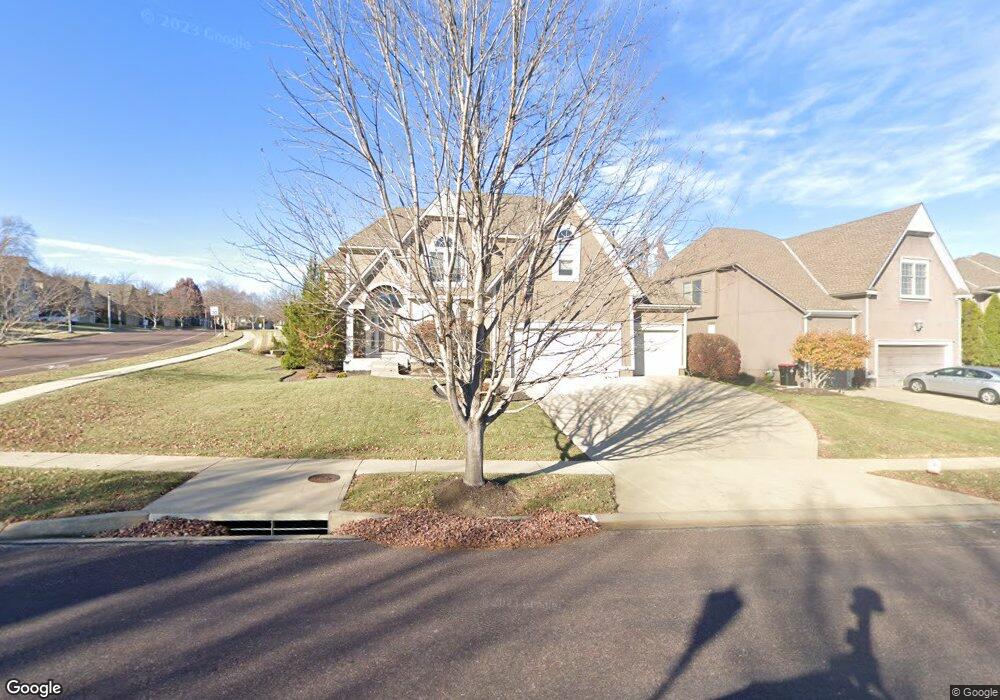
12604 W 139th St Overland Park, KS 66221
Nottingham NeighborhoodEstimated Value: $570,297 - $634,000
4
Beds
5
Baths
2,683
Sq Ft
$220/Sq Ft
Est. Value
About This Home
This home is located at 12604 W 139th St, Overland Park, KS 66221 and is currently estimated at $590,824, approximately $220 per square foot. 12604 W 139th St is a home located in Johnson County with nearby schools including Liberty View Elementary School, Pleasant Ridge Middle School, and Blue Valley West High School.
Ownership History
Date
Name
Owned For
Owner Type
Purchase Details
Closed on
Jun 12, 2007
Sold by
Carpenter James A and Carpenter Kristin D
Bought by
Moes Matthew J and Moes Holly E
Current Estimated Value
Home Financials for this Owner
Home Financials are based on the most recent Mortgage that was taken out on this home.
Original Mortgage
$317,775
Outstanding Balance
$196,333
Interest Rate
6.37%
Mortgage Type
New Conventional
Estimated Equity
$394,491
Purchase Details
Closed on
Jul 18, 2001
Sold by
Tomahawk Partners Llc
Bought by
James Iii Homes Inc
Purchase Details
Closed on
Jan 3, 2001
Sold by
James Iii Homes Inc
Bought by
Carpenter James A and Carpenter Kristin D
Home Financials for this Owner
Home Financials are based on the most recent Mortgage that was taken out on this home.
Original Mortgage
$237,000
Interest Rate
7.15%
Create a Home Valuation Report for This Property
The Home Valuation Report is an in-depth analysis detailing your home's value as well as a comparison with similar homes in the area
Home Values in the Area
Average Home Value in this Area
Purchase History
| Date | Buyer | Sale Price | Title Company |
|---|---|---|---|
| Moes Matthew J | -- | First American Title Insuran | |
| James Iii Homes Inc | -- | Security Land Title Company | |
| Carpenter James A | -- | Security Land Title Company |
Source: Public Records
Mortgage History
| Date | Status | Borrower | Loan Amount |
|---|---|---|---|
| Open | Moes Matthew J | $317,775 | |
| Previous Owner | Carpenter James A | $237,000 |
Source: Public Records
Tax History Compared to Growth
Tax History
| Year | Tax Paid | Tax Assessment Tax Assessment Total Assessment is a certain percentage of the fair market value that is determined by local assessors to be the total taxable value of land and additions on the property. | Land | Improvement |
|---|---|---|---|---|
| 2024 | $6,003 | $58,570 | $10,746 | $47,824 |
| 2023 | $6,029 | $57,845 | $10,746 | $47,099 |
| 2022 | $5,338 | $50,336 | $10,746 | $39,590 |
| 2021 | $5,014 | $44,885 | $9,772 | $35,113 |
| 2020 | $4,853 | $43,148 | $7,811 | $35,337 |
| 2019 | $5,140 | $44,724 | $6,018 | $38,706 |
| 2018 | $4,936 | $42,101 | $6,020 | $36,081 |
| 2017 | $4,846 | $40,606 | $6,020 | $34,586 |
| 2016 | $4,575 | $38,306 | $6,020 | $32,286 |
| 2015 | $4,532 | $37,789 | $6,020 | $31,769 |
| 2013 | -- | $35,328 | $6,020 | $29,308 |
Source: Public Records
Map
Nearby Homes
- 13915 Rosehill Ln
- 13921 Westgate St
- 12501 138th Place
- 12313 138th Place
- 12505 138th Place
- 13833 Westgate St
- 13849 Westgate St
- 13825 Westgate St
- 13837 Westgate St
- 13841 Westgate St
- 12616 138th Place
- 12612 138th Place
- 12704 W 138th Place
- 12204 W 138th Place
- 13808 Monrovia St
- 13001 W 139th St
- 12200 W 138th Place
- 13808 Quigley St
- 13205 W 137th Place
- The Amarone Plan at Solera Reserve
- 12600 W 139th St
- 16700 Rosehill
- 12611 W 138th Ct
- 12607 W 138th Ct
- 12512 W 139th St
- 13864 Rosehill
- 13900 Westgate St
- 12701 W 141st St
- 13860 Rosehill
- 12603 W 138th Ct
- 12508 W 139th St
- 13856 Rosehill
- 13904 Westgate St
- 13901 Westgate St
- 12705 W 141st St
- 141 W 141st St
- 14011 Rosehill Ln
- 13852 Rosehill
- 13908 Westgate St
- 14007 Rosehill Ln