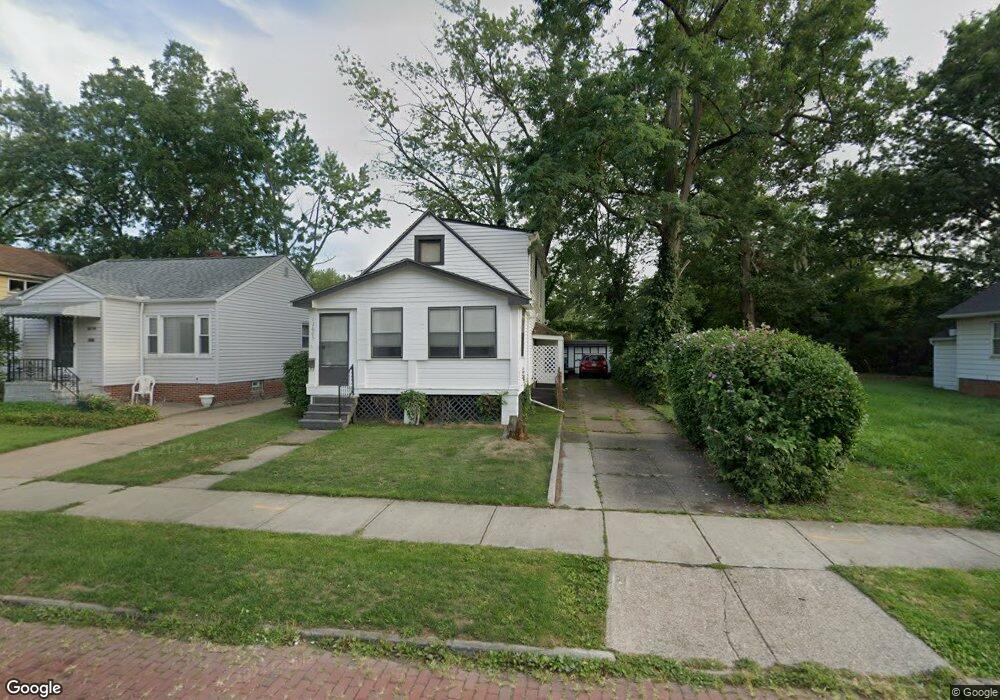
12605 Leeila Ave Cleveland, OH 44135
Bellaire-Puritas NeighborhoodEstimated Value: $118,000 - $123,000
3
Beds
1
Bath
1,064
Sq Ft
$114/Sq Ft
Est. Value
About This Home
This home is located at 12605 Leeila Ave, Cleveland, OH 44135 and is currently estimated at $120,797, approximately $113 per square foot. 12605 Leeila Ave is a home located in Cuyahoga County with nearby schools including Artemus Ward School, Almira Academy, and Benjamin Franklin.
Ownership History
Date
Name
Owned For
Owner Type
Purchase Details
Closed on
Aug 25, 1997
Sold by
Meng Bradley P
Bought by
Hoch Allan R
Current Estimated Value
Home Financials for this Owner
Home Financials are based on the most recent Mortgage that was taken out on this home.
Original Mortgage
$39,366
Outstanding Balance
$6,149
Interest Rate
7.56%
Mortgage Type
FHA
Estimated Equity
$114,648
Purchase Details
Closed on
Dec 12, 1990
Sold by
Meder Dean C
Bought by
Meng Bradley P
Purchase Details
Closed on
May 19, 1989
Sold by
Meder Dean C and Meder Maureen D
Bought by
Meder Dean C
Purchase Details
Closed on
Jun 3, 1987
Bought by
Meder Dean C and Meder Maureen D
Purchase Details
Closed on
Jun 26, 1986
Sold by
Evans Scott C
Bought by
Federal S & L Assoc
Purchase Details
Closed on
May 3, 1978
Sold by
Clark John V and Clark Fannie K
Bought by
Evans Scott C
Purchase Details
Closed on
Jan 1, 1975
Bought by
Clark John and Clark Fannie K
Create a Home Valuation Report for This Property
The Home Valuation Report is an in-depth analysis detailing your home's value as well as a comparison with similar homes in the area
Home Values in the Area
Average Home Value in this Area
Purchase History
| Date | Buyer | Sale Price | Title Company |
|---|---|---|---|
| Hoch Allan R | $39,000 | -- | |
| Meng Bradley P | $28,000 | -- | |
| Meder Dean C | -- | -- | |
| Meder Dean C | $12,500 | -- | |
| Federal S & L Assoc | -- | -- | |
| Evans Scott C | $20,000 | -- | |
| Clark John | -- | -- |
Source: Public Records
Mortgage History
| Date | Status | Borrower | Loan Amount |
|---|---|---|---|
| Open | Hoch Allan R | $39,366 |
Source: Public Records
Tax History Compared to Growth
Tax History
| Year | Tax Paid | Tax Assessment Tax Assessment Total Assessment is a certain percentage of the fair market value that is determined by local assessors to be the total taxable value of land and additions on the property. | Land | Improvement |
|---|---|---|---|---|
| 2024 | $2,488 | $37,205 | $7,665 | $29,540 |
| 2023 | $947 | $12,220 | $3,290 | $8,930 |
| 2022 | $942 | $12,220 | $3,290 | $8,930 |
| 2021 | $933 | $12,220 | $3,290 | $8,930 |
| 2020 | $838 | $9,490 | $2,560 | $6,930 |
| 2019 | $776 | $27,100 | $7,300 | $19,800 |
| 2018 | $774 | $9,490 | $2,560 | $6,930 |
| 2017 | $853 | $10,090 | $2,210 | $7,880 |
| 2016 | $847 | $10,090 | $2,210 | $7,880 |
| 2015 | $923 | $10,090 | $2,210 | $7,880 |
| 2014 | $923 | $10,960 | $2,420 | $8,540 |
Source: Public Records
Map
Nearby Homes
- 12508 Sobieski Ave
- 12620 Grimsby Ave
- 12510 Grimsby Ave
- 12312 Guardian Blvd
- 4059 W 130th St
- 11913 Matherson Ave
- 13206 Liberty Ave
- 13209 Liberty Ave
- 11808 Leeila Ave
- 13313 Highlandview Ave
- 4329 W 131st St
- 13402 Saint James Ave
- 12400 Saint John Ave
- 4349 W 132nd St
- 3958 W 130th St
- 12510 Summerland Ave
- 13301 Courtland Ave
- 12605 Brooklawn Ave
- 13410 Gilmore Ave
- 4162 Victory Blvd
- 12601 Leeila Ave
- 12609 Leeila Ave
- 12519 Leeila Ave
- 12613 Leeila Ave
- 12515 Leeila Ave
- 12618 Kadel Ave
- 12617 Leeila Ave
- 12604 Leeila Ave
- 12626 Kadel Ave
- 12600 Leeila Ave
- 12612 Leeila Ave
- 12518 Leeila Ave
- 12616 Leeila Ave
- 12630 Kadel Ave
- 12514 Leeila Ave
- 12620 Leeila Ave
- 0 Kadel Unit 51 2460625
- * Kadel Ave
- 12500 Bellaire Rd
- 12700 Kadel Ave